
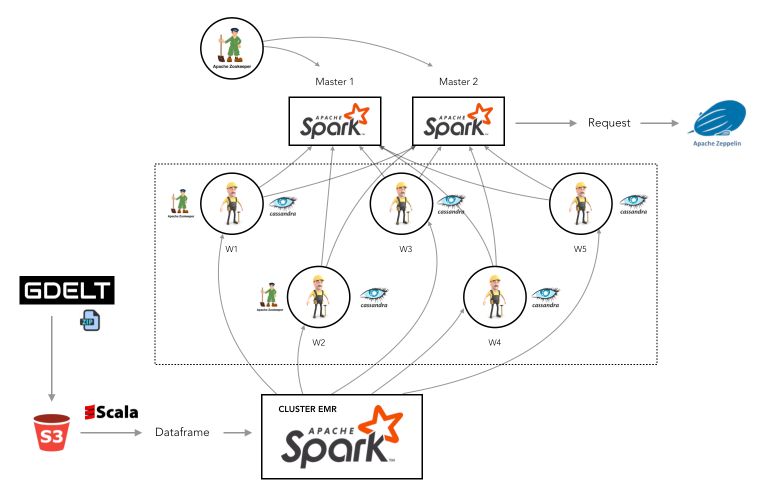
Big Data, A Cassandra DB for geo-political data (GDELT)
The GDELT Project monitors the world’s broadcast, print, and web news from nearly every corner of every country in over 100 languages and identifies the people, locations, organizations, themes, sources, emotions, counts, quotes …in the entire world. With new files uploaded every 15 minutes, GDELT data bases contain more than 500 Gb of zipped data for the single year 2018.
In a group project, we worked on a resilient No-SQL (Cassandra) database architecture on EC2 instances. The pipeline for the data processing was developped in Spark-Scala. The visualization implied Zeppelin Notebooks.
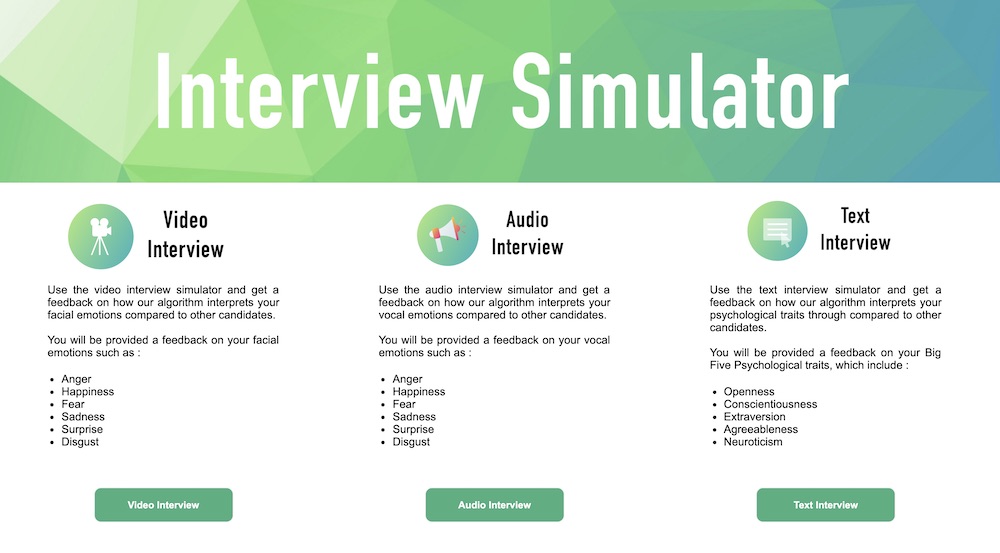
Deep Learning : Multimodal Sentiment Analysis (Text, Sound, Video)
In this research project in partnership with the French Employment Agency, we explored state of the art models in multimodal sentiment analysis. We have chosen to explore textual, sound and video inputs, and predict emotions / psychological traits associated to each modality. We developped a Flask web app that gathers all this information, and presents a visualization of the performance of the person.
The working paper can be found here :
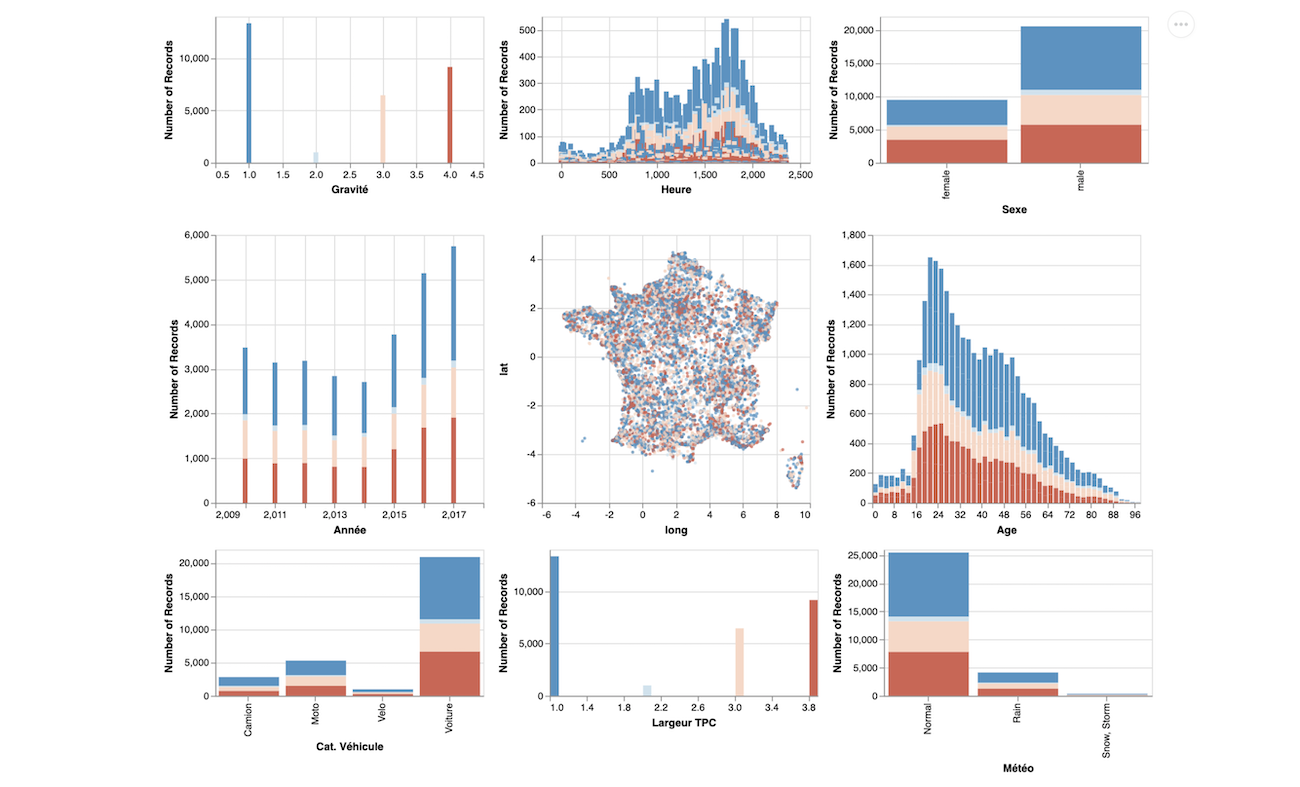
DataVisualization
Every year, around 560 billion kilometers are being travelled by car in France. This is 1.5 million times more than the distance between earth and the moon. As a direct consequence, yearly, more than 3’500 die yearly on the French roads.
In this data visualization project, my group and I analyze the road traffic accidents from the French national database between 2005 and 2017, with 3 interesting designs that bring hidden insights to the users.
The tool can also be accessed online, right here : https://infoviz.onrender.com/.
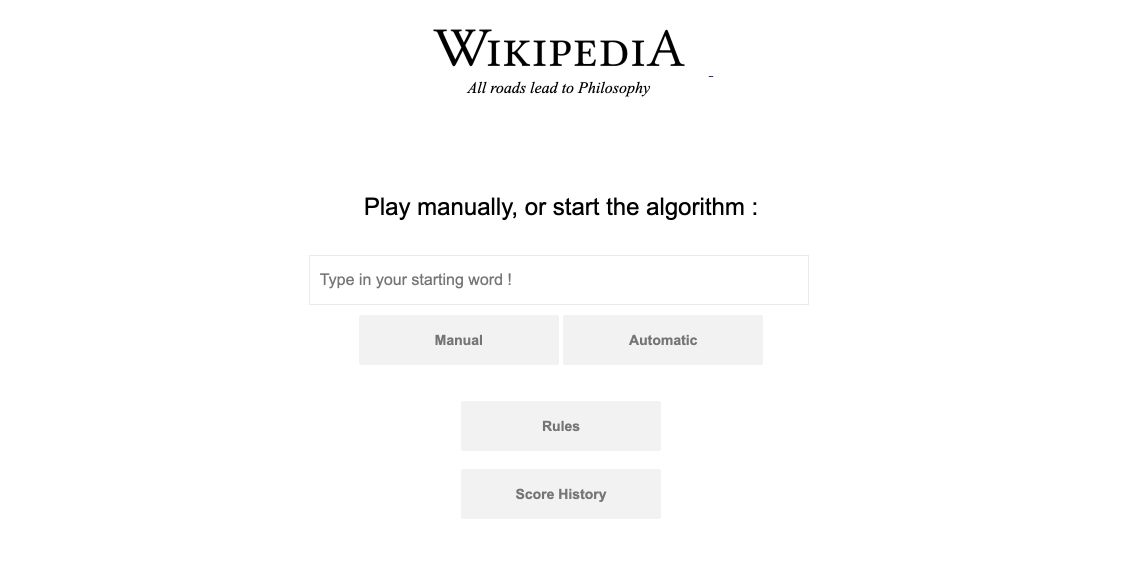
Wikipedia Web App
According to ReadWriteWeb, all articles in the English version of Wikipedia lead to the article “Philosophy”. If you click on the first link of each article, you will come across the Philosophy article after a while.
In order to verify this assertion, I developped a small WebApp with 2 simple options :
- A manual Wikipedia Link explorer that requests Wikipedia’s API
- An automatic exploration that systematically chooses the first link among results
D3.js Interactive Map of France
In this project, I created an interactive map with a few main features :
- display the map of France (population and density)
- change the color of the map with a simple button
- display a tooltip with the name of the city and the postal code
- zoom on the map and update the axis accordingly
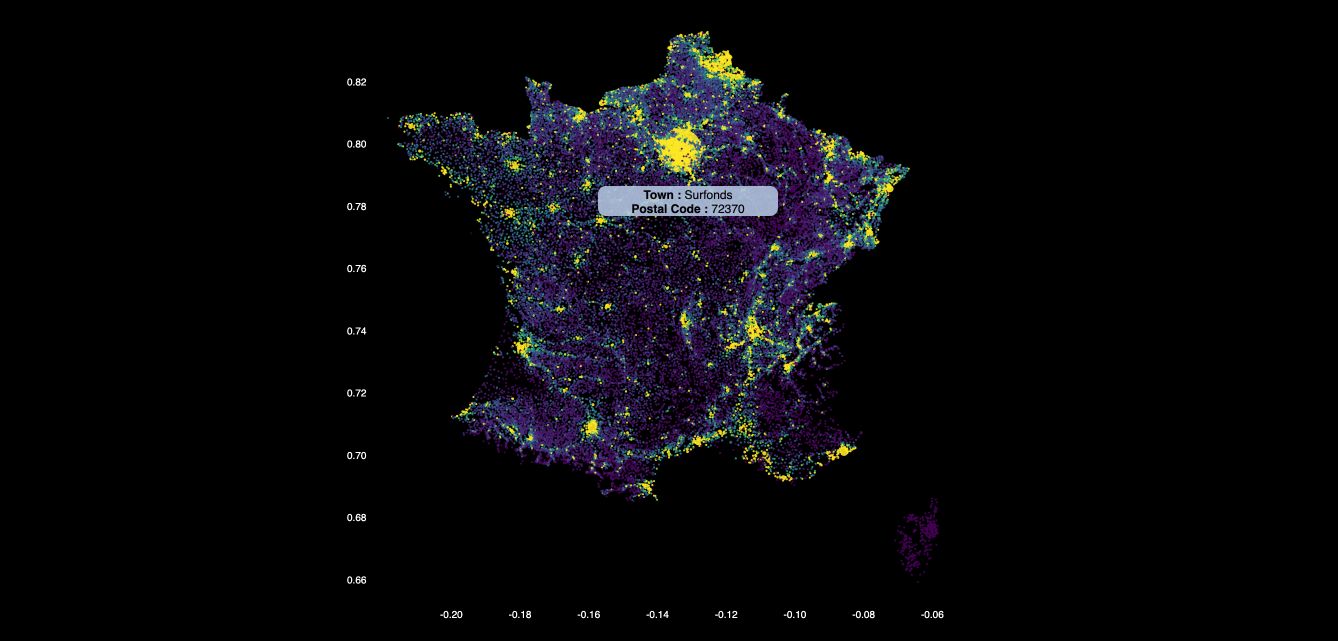
The tool can be accessed here, and the code here.
Altair Interactive Graph
I developped a small interactive tool that allows to visualize the embedded features of a road (width, slope…), and the associated accident rate, using T-SNE embedding.
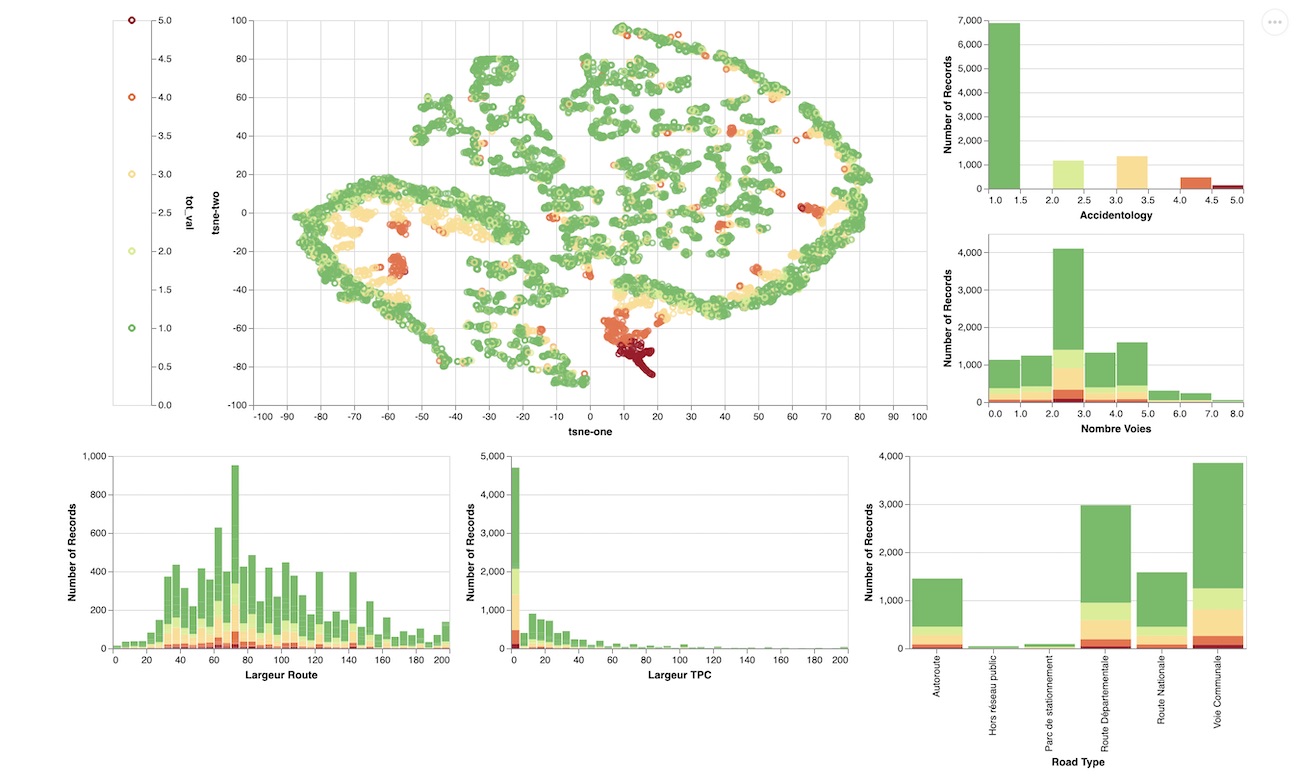
The tool can be accessed here.
Multi-Regression : Estimating a position from a received signal strength for IoT sensors
Smart devices such as IoT sensors use low energy consuming networks such as the ones provided by Sigfox or Lora. But without using GPS networks, it becomes harder to estimate the position of the sensor. The aim of this study is to provide a geolocation estimation using Received Signal Strength Indicator in the context of IoT. The aim is to allow a geolocation of lowconsumption connected devices using the Sigfox network. State of the art modelsare able to be precise to the nearest kilometer in urban areas, and around tenkilometers in less populated areas.
Econometrics
An econometrics project in which I covered :
- linear regression
- statistical testing (t-test, F-test, Chow, ANOVA)
- time series analysis
NLP : Analyzing GitHub Pull Requests
In this project, I have been looking at comments of developers on GitHub pull requests in order to :
- determine the main topics (LSA Topic Modelling)
- identify clusters of words (KMeans)
- predict if a merge will occur after the comment (Bag Of Words, TF-IDF)
- predict the time before the merge
A Deep Learning Approach to Face Classification
In this challenge, our aim was to develop face classification algorithms using Deep Learning Architectures. I have explored hand-made CNNs, Inception, XCeption, VGG16, DenseNet or ResNet networks for binary classification purposes.
Classification : Predicting the predominant kind of tree (Kaggle)
In this challenge , I am trying to predict the forest cover type (the predominant kind of tree cover) from strictly cartographic variables (as opposed to remotely sensed data) .
Cyber Security (Splunk)
I used Splunk in a Cyber Security Project. The aim of the project was to identify the source of a data leakage within the company. We went through the logs, identified suspect IP addresses, found the source of the attack (a corrupted PDF), estimated the volume of data stolen, and proposed immediate actions. We detailed the Diamond Model, the Cyber Kill Chain, and developped general perspectives for the Cyber Threat Intelligence of the company.
Hackathons
Predicting the Song of the year (1/3)