
Facebook recently open-sourced a time-series forecasting library called Prophet. It is incredibly simple to use, and the outcomes are worth mentioning.
The data I’m using can be downloaded from https://maelfabien.github.io/assets/files/file.csv.
Start by importing the following packages :
import numpy as np
import pandas as pd
import matplotlib.pyplot as plt
from fbprophet import Prophet
Then, load the data :
df = pd.read_csv('file.csv', parse_dates=['date'], index_col='date')
df.head()
| value | date |
| 1991-07-01 | 3.526591 |
| 1991-08-01 | 3.180891 |
| 1991-09-01 | 3.252221 |
| 1991-10-01 | 3.611003 |
| 1991-11-01 | 3.565869 |
We first need to rename the columns to match Prophet’s needs :
df = pd.DataFrame(df['value'].dropna()).reset_index().rename(columns={'date': 'ds', 'value': 'y'})
Then, declare and fit the model :
model = Prophet(interval_width=0.95)
model.fit(df)
Finally, make the forecast over 3 years here (36 months).
forecast = model.make_future_dataframe(periods=36, freq='MS')
forecast = model.predict(forecast)

plt.figure(figsize=(18, 8))
model.plot(forecast, xlabel = 'Date', ylabel = 'Consumption')
plt.title('Index')
plt.show()
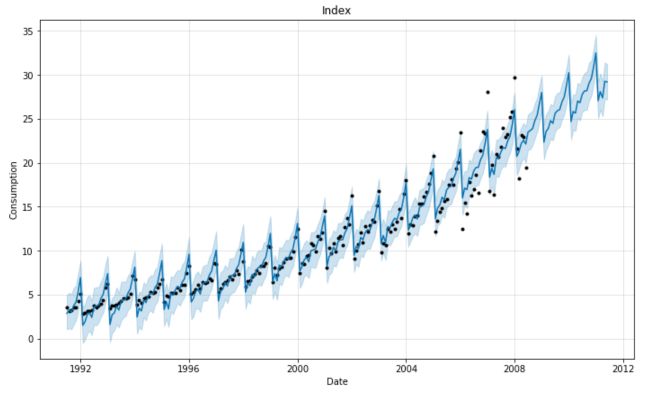
The forecast data frame contains all the predictions.
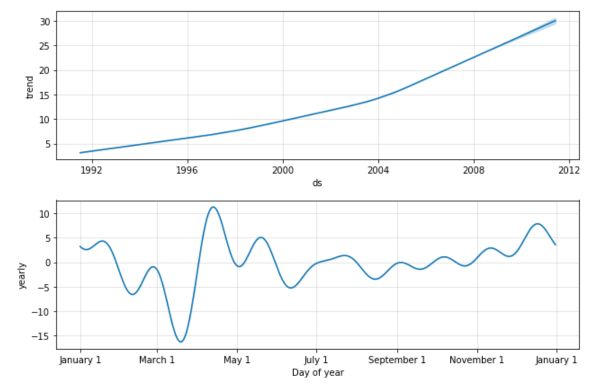
Prophet even shows the decomposition of the series :
model.plot_components(forecast);
I don’t know if I would use such a tool in production, but it’s definitely something interesting that you should consider in your Time Series analysis!