Interactive Map with D3.js
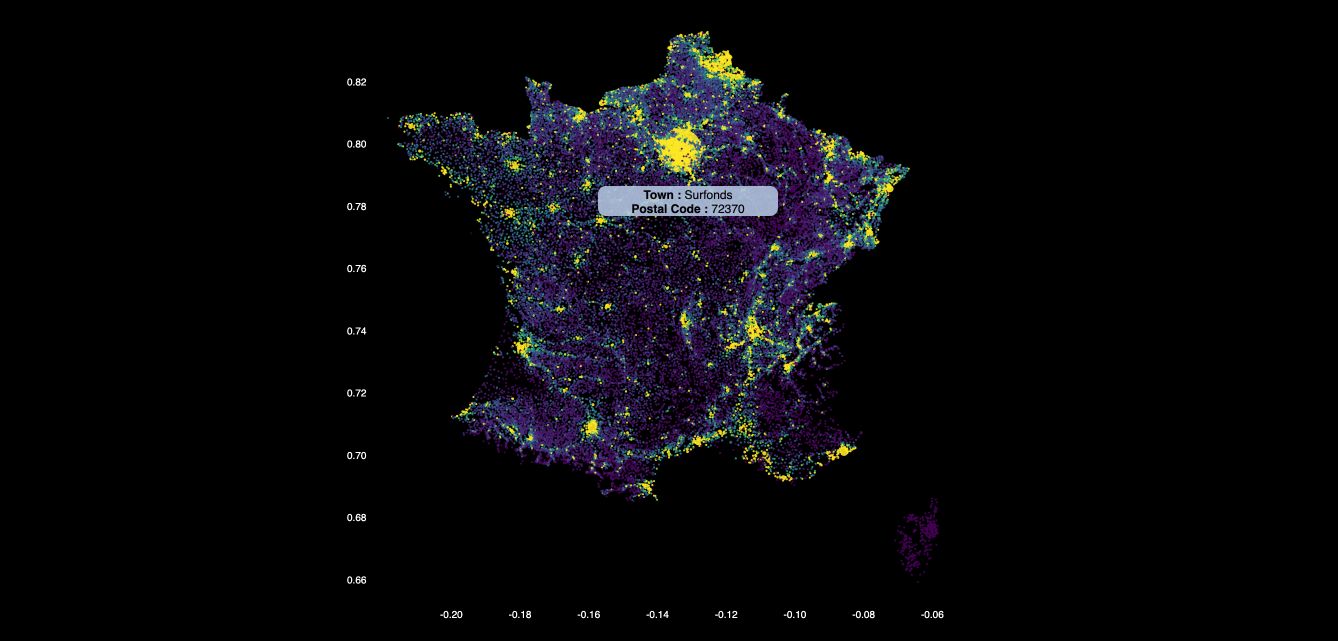
I developped an interactive D3.js plot of the population density of France. The tool highlights dense regions of France, and has a zoom feature.
A demonstration hosted on my site can be found here.

I developped an interactive D3.js plot of the population density of France. The tool highlights dense regions of France, and has a zoom feature.
A demonstration hosted on my site can be found here.