
I have recently been working on time-varying networks, i.e. networks for which we have timestamps of various interactions between the nodes. This is the case for social networks or criminal networks for example. When we analyze the centrality of the nodes of a graph, it gives us a snapshot at the exact moment of the structure of the graph.
However, these networks are time-varying by nature. They evolve, new interactions are being made, new nodes are created… And knowing which nodes are going to be central next month can be a key information in criminal investigations. For this reason, I wanted to spend some time and look at whether one can actually predict the central nodes in the future.
Dataset
I am working on the Enron e-mail dataset, enriched by phone calls that I was able to match. I have overall 1264 events, each event being either an email or a phone call between 2 characters (or more). For each event, I create a row in the training dataset for each node. Overall, my final dataset is made of more than 50’000 rows.
The timestamps vary between 2000-08-03 09:10:00 and 2001-01-29 22:21:00. Thus, we have a time period of close to 4 months of events. The first thing that we should look at is the evolution of the centrality of the nodes over time.
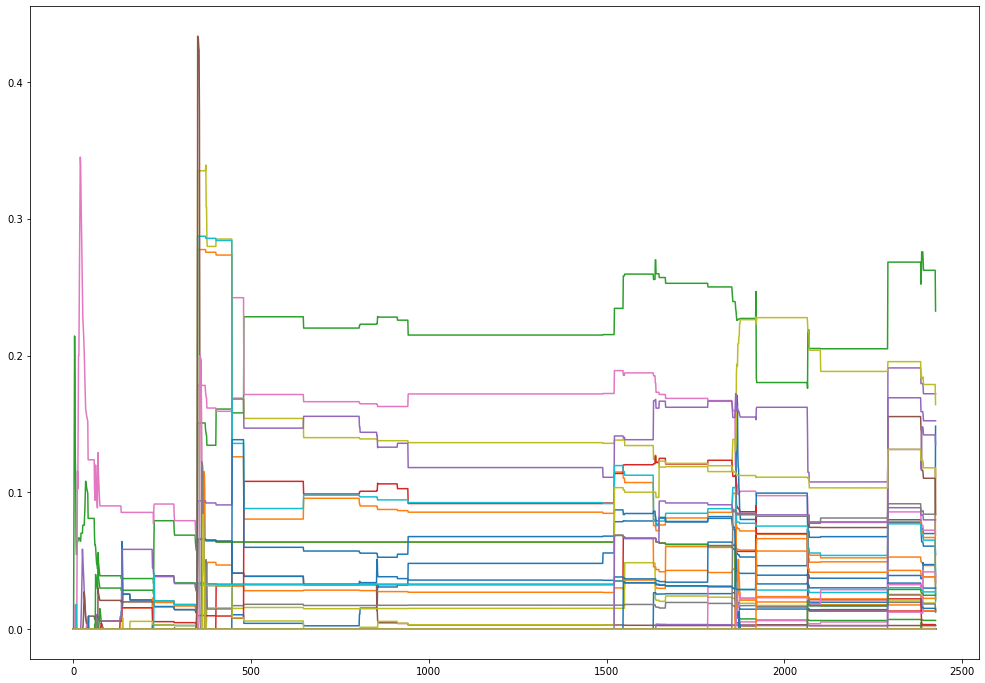
There seems to be some changes over time over in the order of the major nodes. There also seems to be some dates at which at lot of events were collected, typically because phone calls were not registered continuously.
Feature extraction
I turned the node betweenness centrality score prediction into a supervised learning problem. My task will be to predict which node will be central in 1 month from now. This can be useful for police investigations since it does take time to plan when to arrest criminals for example.
To build my dataset, for each node, for each date, I am collecting:
- the conversation date
- the betweenness centrality
- the relative degree centrality
- the clustering coefficient of the node
- the eigen vector centrality
- the katz centrality
- the load centrality
- the harmonic centrality
- if the node is in the max clique of the graph
- the average clustering of the graph
- if the node is in the minimum weighted dominating set
In Python, I use NetworkX to implement this feature extraction.
all_features = []

for conv in df.iterrows():

    # If a least 2 characters in the conversation
    if len(conv[1]['characters']) >= 2:

    	# Add the edges
        for elem in list(itertools.combinations(conv[1]['characters'], 2)):

            G.add_edge(elem[0], elem[1])

        # Collect node features
        for node in G.nodes():

            feature = []

            feature.append(conv[1]['Date'])
            feature.append(node)
            feature.append(betweenness_centrality(G)[node])
            feature.append(G.degree[node]/sum(dict(G.degree).values()))
            feature.append(nx.clustering(G)[node])
            feature.append(nx.eigenvector_centrality(G)[node])
            feature.append(nx.katz_centrality(G)[node])
            feature.append(nx.closeness_centrality(G)[node])
            feature.append(nx.load_centrality(G)[node])
            feature.append(nx.harmonic_centrality(G)[node])

            if node in max_clique(G):
                feature.append(1)
            else:
                feature.append(0)
            feature.append(average_clustering(G))

            if node in min_weighted_dominating_set(G):
                feature.append(1)
            else:
                feature.append(0)

            all_features.append(feature)
I then build a column “is top 5” if the node is within the 5 nodes with the highest centrality at the given date. In order to add some additional features, I also append for each node the features at the 5 previous states, and create features that reflect the differences between each state.
Then, knowing the situation of the network in 1 month from now, I collect the 5 nodes with the highest centrality at that time, and create a column “will be top 5”. I must drop the last month of my dataset since it typically would be the period I would neeed to predict on in real life.
Model Performance
My dataset is now made of 48744 rows and 125 columns. To create my training and test sets, I must split in time the dataset, in order not to include information from the future. Since there is a class imbalance (is among the five nodes with the highest centrality, and all the other nodes), I chose the F1-score metric. I then compare:
- the naive approach of predicting the current centrality
- and the model output
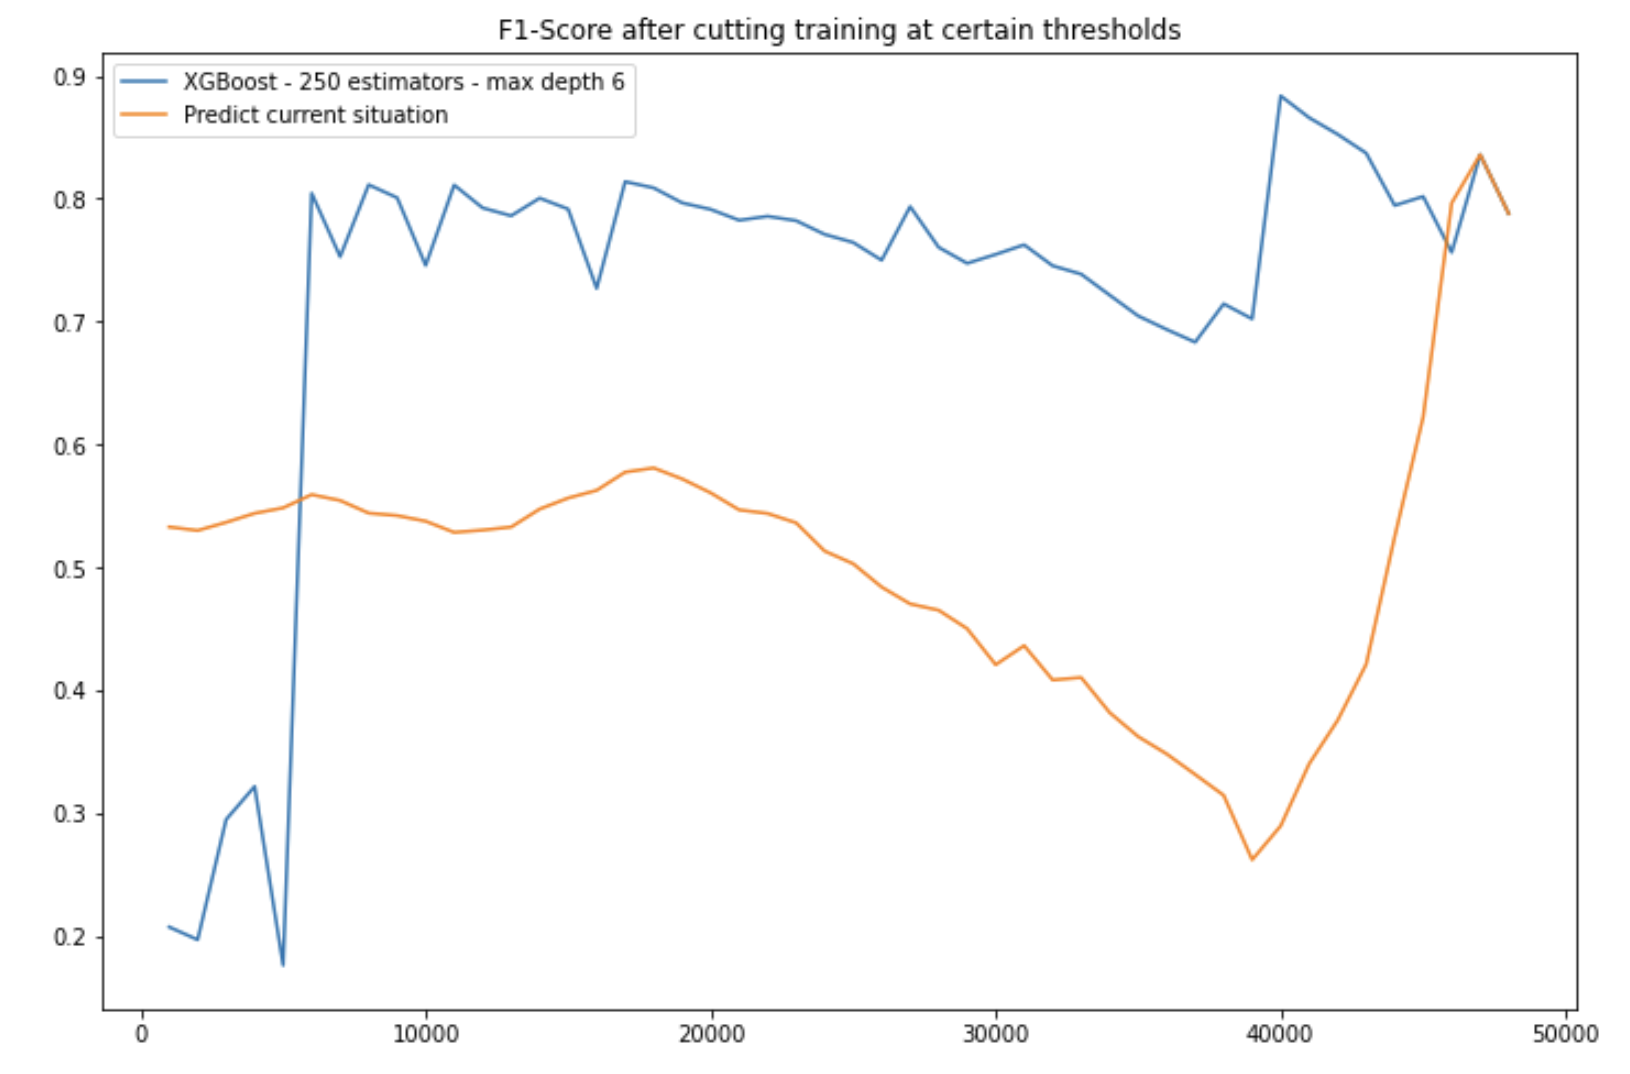
Talking about the model, I chose an XGBoost with 250 estimators and a max-depth of 6. Since splitting at a random point in time would not be reliable enough, I chose to split to 50 different points in time (every 1000 rows), and plot the results below:
Discussion
As we can see, when the XGBoost model sees few training examples, the naive approach clearly outperforms our model. However, with around 6-7’000 training samples, XGBoost clearly outperforms the naive approach. The F1-Score of our prediction is ± 80%, with an accuracy of around 98%, largely over the average F1-Score of the naive approach of 50.6%.
We can plot the feature importance of the XGBoost model:
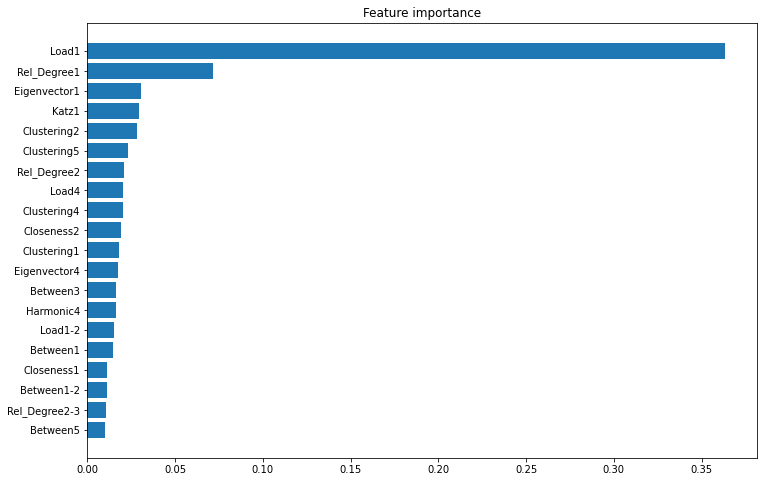
We observe that:
- the current load centrality appears to be most important feature to predict betweenness centrality 1 month ahead
- other features extracted from the current topology of the network are important
- clustering coefficient and relative degree from previous steps are also important
- the evolution between relative degrees from one state to another are not as useful features as expected
Overall, predicting the node centrality based on extracted features from the network in a supervised fashion seems to be feasible. The results seem ancouraging and may suggest that investigators in a criminal investigation could use such approach to predict the node centrality one month ahead and plan their surveillance programs accordingly.