
Machine learning (ML) has been a rising trend over the last years. ML includes a set of techniques that go beyond statistics. In this article, we’ll cover the most important concepts behind ML.
Why machine learning?
Machine learning goes beyond statistics. Indeed, we face the following technical challenges :
- the volume, complexity, and dimension of data to process
- the diversity of the context: supervised, unsupervised…
The improvement of the computation power and cloud computing have also allowed machine learning to become a standard that goes beyond statistical inference.
Supervised vs. Unsupervised
Suppose we are given a set of data points \(X_1, X_2, ... X_m\). These points might represent anything measurable you could think of (e.g humidity in the air, population density or even pixels of an image), and are the variables we will rely on.
There are 2 subcases :
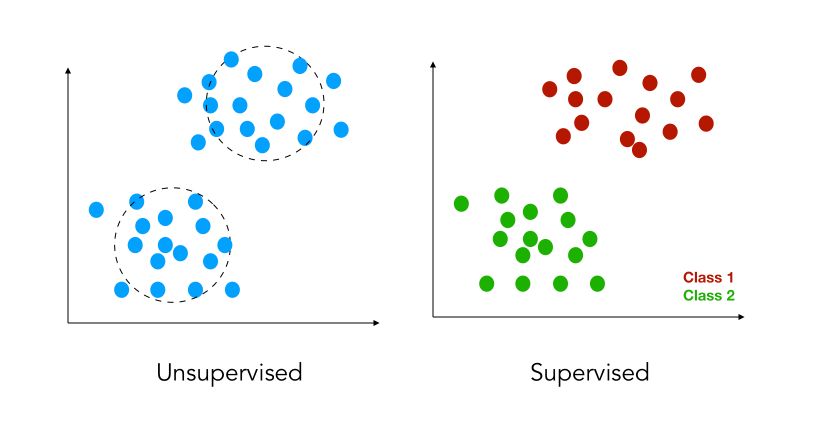
- either we have labels attached to the variables: \(y_1, y_2, ... y_m\). The labels are in some sense the output we want to be able to forecast (e.g the price of a house, a stock price..). This is called supervised learning.
- in some cases, we do not have the labels. In those cases, our aim should be to group observations that appear to be similar to clusters. This is called unsupervised learning.
- you might also encounter the term of semi-supervised data. This simply means that only some data points are labeled.
Regression vs. Classification
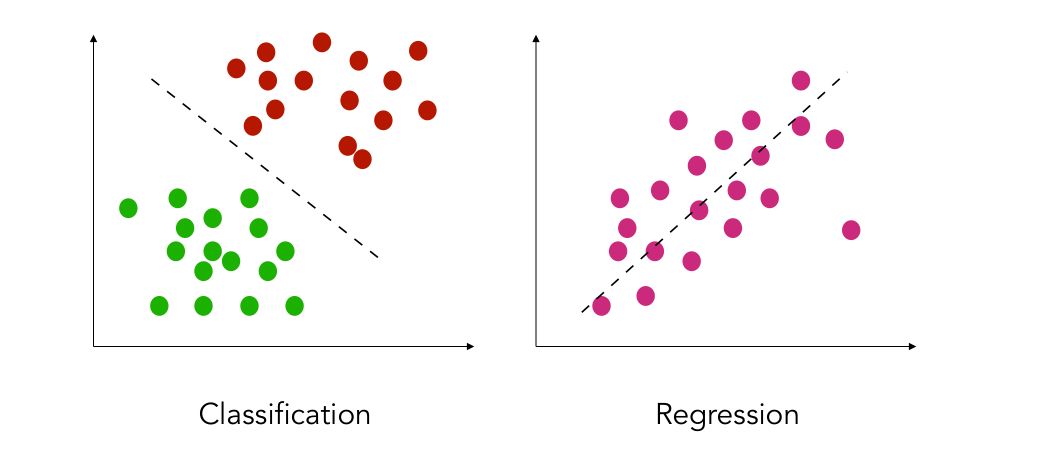
In supervised learning, there are two types of prediction problems you will be solving. Either trying to classify a new observation to the class it belongs to (classification), or trying to predict a continuous outcome (regression). For example :
- in fraud detection, you rely on some measured data to predict if a bank payment is fraudulent or not. If it is fraudulent, you should predict 1. Else, predict 0.
- in stock market analysis, you will be trying to predict the value of the stock itself, and this is a regression problem
Train vs. Test
Most of the time, to assess the efficiency of a classifier or a regressor, we split the data we have into a train and a test set. The idea is to train the model on the train set, and assess its efficiency on the test set. This allows us to prevent overfitting (i.e developing a model too complex that learns too much from the data we provide it).
Discriminative vs. Generative
There are two main categories of models :
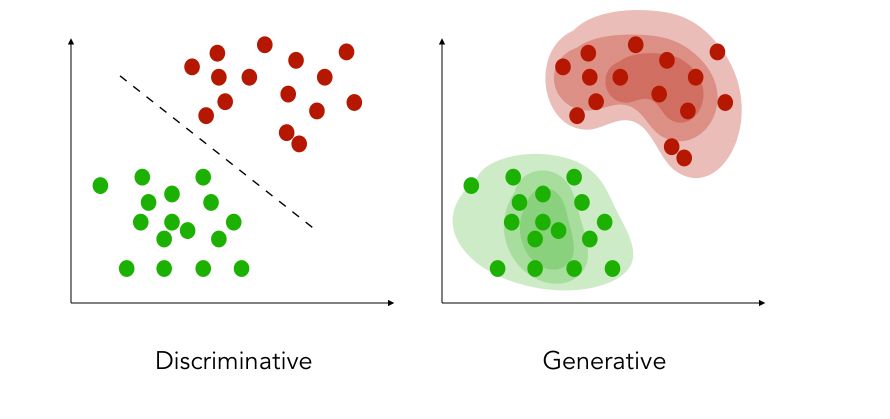
- the discriminative model (most common) tries to estimate the probability of \(y\) given \(X\) directly. In classification, we try to estimate the decision boundary between the labels of the data without paying attention to the distribution of the labeled data themselves. Most classifiers are of this type.
- the generative model tries to estimate the probability of \(X\) given \(y\) to later on deduce the probability of \(y\) given \(X\). We learn the probability distribution of the data. Discriminant analysis and Naïve Bayes are examples of such classifiers.
Error rate and Empirical Risk Minimization
We’ll consider a classification problem here. The aim of building a model is to be able to predict for a new observation the class it belongs to. If we had to define a metric for this, it would be the accuracy. We want to build a classifier \(C\) that minimizes the number of miss-classified examples among our data. The loss of the model, i.e the error measure we can define, is the following :
\[L(C) = E( I (Y≠C(X) ) )\]An optimal classifier should meet the following criteria :
\[C^* = {argmin}_{C ∈ G} L(C)\]It can quite easily be shown that the solution to this problem is :
\[C^* = 2 * I( P(Y=1 | X = x) > 1/2) - 1\]In practice, we have access to a limited number of observations. For such reason, we try to minimize the error on the test sample with the empirical risk minimization (ERM) :
\[\hat{L_n}(C) = \frac {1} {n} \sum I (Y_i ≠ C(X_i) ) )\]Learning works if when \(n\) tends to infinity, \(\hat{L_n}(C)\) tends to \(L(C)\). The theory of Vapnik-Chervonenkis offers guarantees for the prediction as long as the underlying model is not too complex.
How to assess the performance of a model?
Several metrics can be used to assess how well a model is performing.
Classification
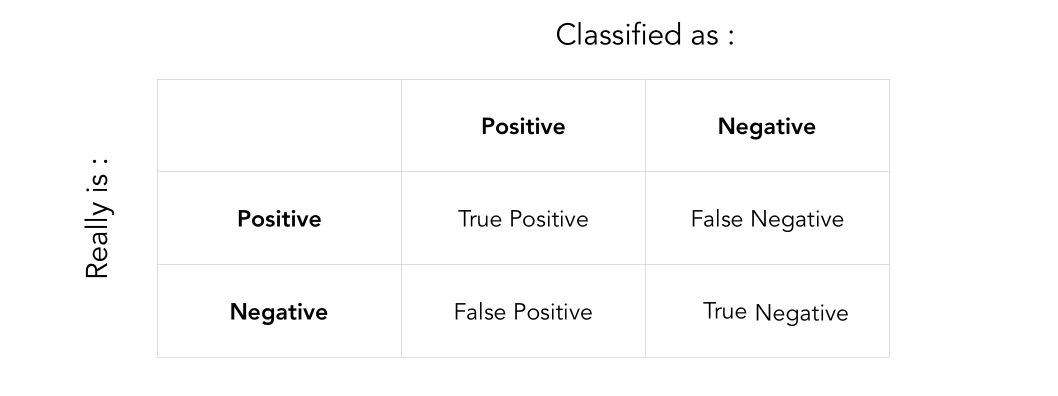
For a classification problem, we first need to recall the following concepts :
Notation :
- TP: True positive
- TN: True negative
- FP: False positive
- FN: False negative
Then, we can define :
- the accuracy, the most widely used metric in classification, useful when there is a certain balance between classes : \(Accuracy = \frac {TP + TN} {TP + TN + FP + FN}\)
- the precision : \(Precision = \frac {TP} {TP + FP}\)
- the recall, or precision : \(Recall = \frac {TP} {TP + FN}\)
- the specificity : \(Specificity = \frac {TN} {TN + FP}\)
- the F1-Score : \(F1-Score = 2 * \frac {Precision * Recall} {Precision + Recall}\)
Regression
Let’s define \(y\) as the true value, and \(\hat{y}\) as the predicted y-value :
The most important metrics are :
- the Mean Absolute Error (MAE) : \(MAE = \frac {1}{n} \sum \mid {y - \hat{y}} \mid\)
- the Mean Square Error (MSE) : \(MSE = \frac {1}{n} \sum (y - \hat{y})^2\)
- Mean Absolute Percentage Error (MAPE) : \(MAPE = \frac {1} {n} \sum \mid { \frac {y - \hat{y}} {y}} \mid * 100%\)
- Mean Percentage Error (MPE) : \(MPE = \frac {1} {n} \sum { \frac {y - \hat{y}} {y}} * 100%\)
Bias - Variance tradeoff
A model reaching a high accuracy in the training part, and much lower accuracy. In such a case, we face an overfitting issue. This means that our model is in some sense learning too much from the train set and creating a model that might be too complex.
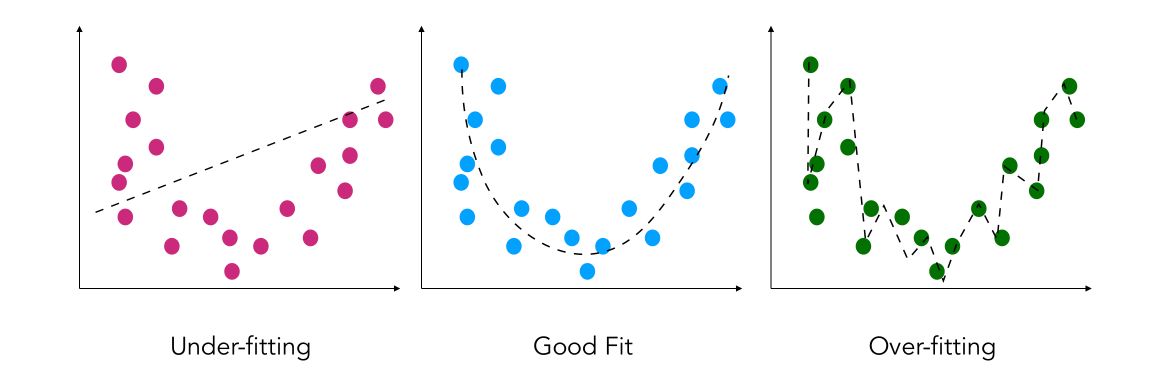
There is a tradeoff to make between the complexity of the model and the predictive power. It can be expressed as : \(E( (y - \hat{y})^2 ) = {Bias}( \hat{y})^2 + {Var}( \hat{y}) + \sigma^2\)
Where :
- \[{Bias}[ \hat{y}] = E(\hat{y}) - y\]
- \[{Var}( \hat{y}) = E(\hat{y}^2) - E(\hat{y})^2\]
- \(\sigma\) is the variance of the noise of the underlying model
Conclusion : This brief introduction to machine learning should get you started for the next series of articles on the different algorithms.