In the previous article, we saw ways to learn in graphs, i.e. make node labeling and edge prediction. One of the limitations of graphs remains the absence of vector features. Just like in NLP, we face structured data. But just like in NLP, we can learn an embedding of the graph! There are several levels of embedding in a graph :
- Embedding graph components (nodes, edges, features…) (Node2Vec)
- Embedding sub-parts of a graph or a whole graph (Graph2Vec)
After learning an embedding, it can be used as features for several tasks :
- classification
- recommender systems
- …
For what comes next, open a Jupyter Notebook and import the following packages :
import numpy as np
import random
import networkx as nx
from IPython.display import Image
import matplotlib.pyplot as plt
If you have not already installed the networkx package, simply run :
pip install networkx
The following articles will be using the latest version 2.x of networkx. NetworkX is a Python package for the creation, manipulation, and study of the structure, dynamics, and functions of complex networks.
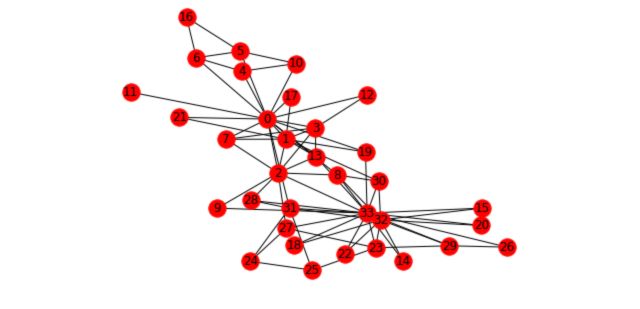
To illustrate the different concepts we’ll cover and how it applies to graphs we’ll take the Karate Club example. This graph is present in the networkx package. It represents the relations of members of a Karate Club. However, due to a disagreement of the founders of the club, the club has recently been split in two. We’ll try to illustrate this event with graphs.
First, load and plot the graph :
n=34
m = 78
G_karate = nx.karate_club_graph()

pos = nx.spring_layout(G_karate)
nx.draw(G_karate, cmap = plt.get_cmap('rainbow'), with_labels=True, pos=pos)

Embedding process
If you have some time, check out the full article on the embedding process by the author of the node2vec library.
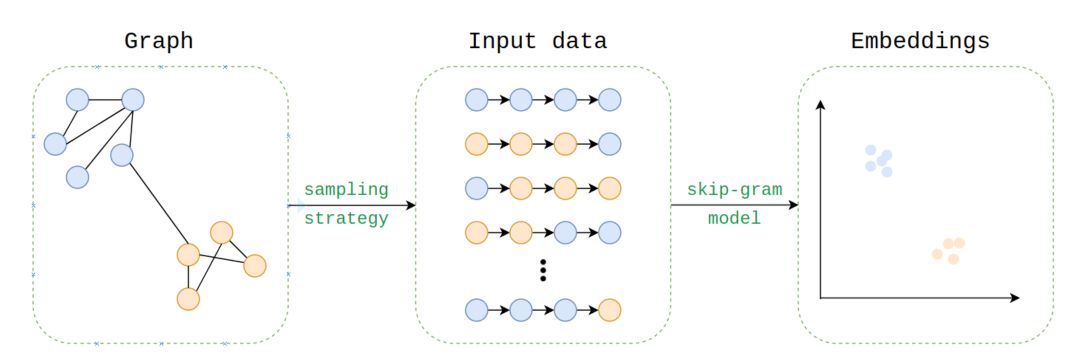
The embeddings are learned in the same way as word2vec’s skip-gram embeddings are learned, using a skip-gram model. The question is, how can we generate the input corpus for Node2Vec? The data are much more complex, i.e. (un)directed, (un)weighted, (a)cyclic…
To generate the corpus, we use random walks sampling strategy :

We can specify the number of walks to run and the length of the walks.
Node Embedding
We will focus on the embedding of graph components. Several approaches are possible to embed a node or an edge. For example, DeepWalk uses short random walks to learn representations for edges in graphs. We will focus on Node2Vec, a paper that was published by Aditya Grover and Jure Leskovec from Stanford University in 2016.
The main difference between DeepWalk and Node2Vec is that in Node2Vec, when developing a random walk, there is a certain probability to go back to the previous node.
According to the authors: “node2vec is an algorithmic framework for representational learning on graphs. Given any graph, it can learn continuous feature representations for the nodes, which can then be used for various downstream machine learning tasks.” How does Node2Vec work? The model learns low-dimensional representations for nodes by optimizing a neighborhood preserving objective, using random walks.
The code of Node2Vec is available on GitHub.
To install the package, simply run: pip install node2vec
Then, in your notebook, we’ll embed the Karate graph :
from node2vec import Node2Vec
Then, pre-compute the probabilities and generate walks :
node2vec = Node2Vec(G_karate, dimensions=64, walk_length=30, num_walks=200, workers=4)
We can then embed the nodes :
model = node2vec.fit(window=10, min_count=1, batch_words=4)
To get the vector of a node, say node ‘2’, use get_vector :
model.wv.get_vector('2')
The outcome has the following form :
array([-0.03066591, 0.52942747, -0.14170371...
It has a length of 64 since we defined the dimension as 64 above. What can we do with this embedding? One of the first options is for example to identify the most similar node!
model.wv.most_similar('2')
It returns a list of the most similar nodes and the corresponding probabilities :
[('3', 0.6494477391242981),
('13', 0.6262941360473633),
('7', 0.6137452721595764),
...
If the nodes have labels, we can train an algorithm based on the embedding and attach a label. This could be a way to node labeling.
Edge Embedding
Edges can also be embedded, and the embedding can be further used for classification.
from node2vec.edges import HadamardEmbedder
edges_embs = HadamardEmbedder(keyed_vectors=model.wv)
Then, retrieve the vectors by specifying the name of the 2 linked nodes :
edges_embs[('1', '2')]
Which heads :
array([-8.1781112e-03, -1.8037426e-01, 4.9451444e-02...
Again, we can retrieve the most similar edge, which can be used for missing edges prediction for example :
edges_kv = edges_embs.as_keyed_vectors()
edges_kv.most_similar(str(('1', '2')))
This heads :
[("('2', '21')", 0.8726599216461182),
("('2', '7')", 0.856759786605835),
("('2', '3')", 0.8566413521766663),
...
Graph Embedding
There are also ways to embed a graph or a sub-graph directly. Graph embedding techniques take graphs and embed them in a lower-dimensional continuous latent space before passing that representation through a machine learning model.
An approach has been developed in the Graph2Vec paper and is useful to represent graphs or sub-graphs as vectors, thus allowing graph classification or graph similarity measures for example. I won’t dive deeper into this technique, but feel free to check the Github of this project :
https://github.com/benedekrozemberczki/graph2vec
It is based on the same idea than doc2vec skip-gram network.
To run the embedding, it’s as easy as :
python src/graph2vec.py --input-path data_folder/ --output-path output.csv
Conclusion : I hope that this article on graph embedding was helpful. Don’t hesitate to drop a comment if you have any question.
Resources :
