In this lab, we will analyze data from a taxi business. The aim of the lab is to :
- Connect to a streaming data Topic in Cloud Pub/sub
- Ingest streaming data with Cloud Dataflow
- Load streaming data into BigQuery
- Analyze and visualize the results with DataStudio
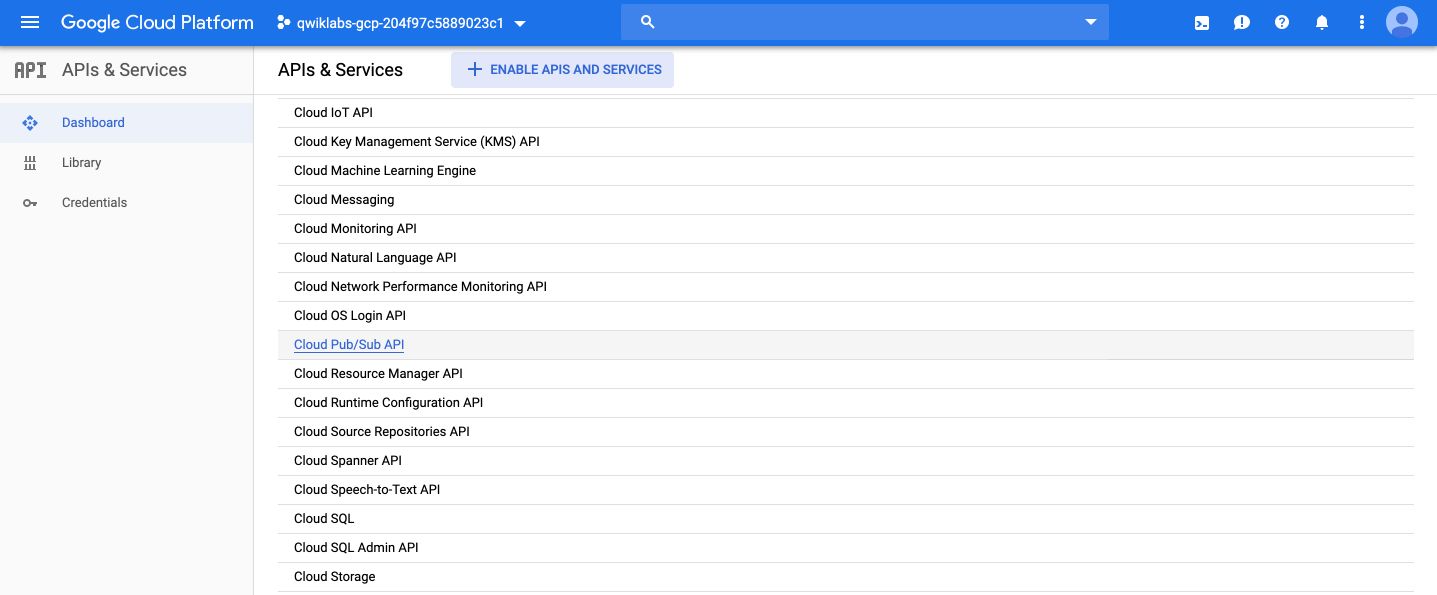
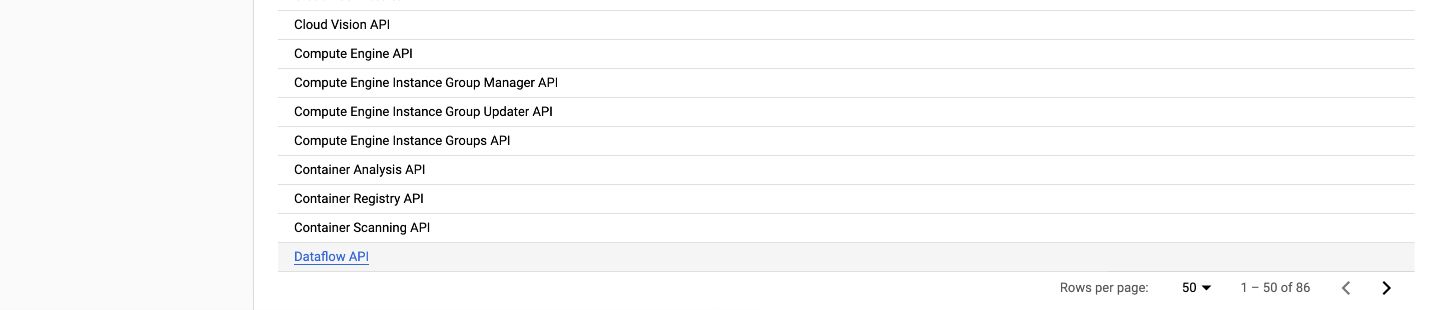
First, we need to confirm that the needed APIs are enabled. On the console, in the side menu, click on “API & Services”. You should see Google Cloud Pub/Sub API and Dataflow API already enabled. If not, enable them.
In this lab, messages published into Pub/Sub will be aggregated and stored in BigQuery. Therefore, we need to create a BigQuery Dataset.
Open a shell, and type the following command :
bq mk taxirides
Then, to create the table, type this command :
bq mk \
--time_partitioning_field timestamp \
--schema ride_id:string,point_idx:integer,latitude:float,longitude:float,\
timestamp:timestamp,meter_reading:float,meter_increment:float,ride_status:string,\

passenger_count:integer -t taxirides.realtime
It creates an empty schema for taxirides.realtime table in which we will stream later.
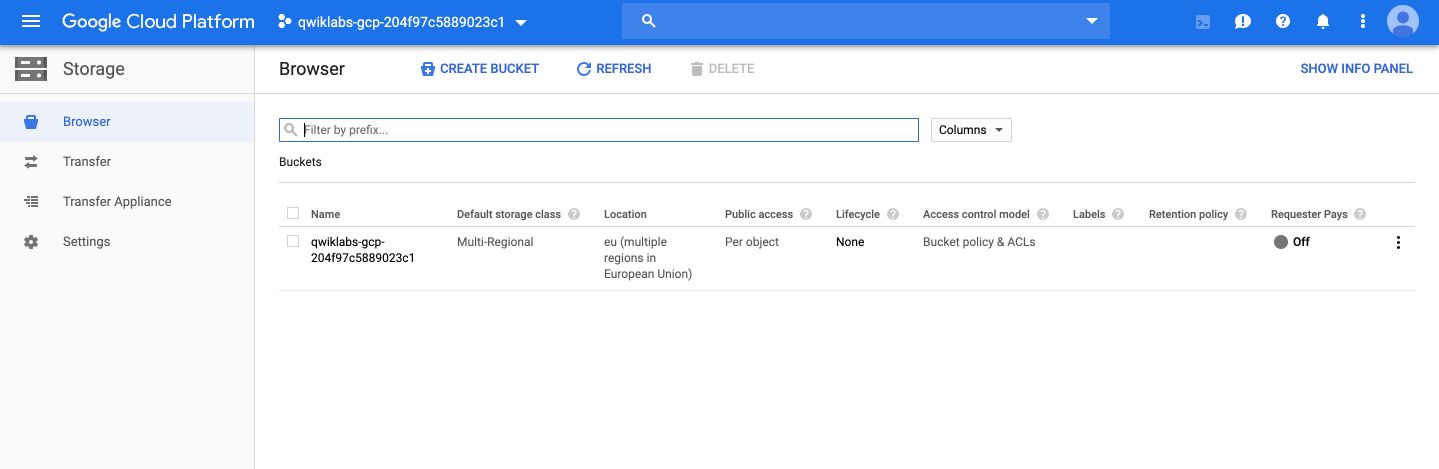
We will then use Cloud Storage to provide working space for our Cloud Dataflow pipeline. To do so, open the Storage tab in the menu, and create a bucket whose name is the same as your project’s name :
Then, we will set up a streaming data pipeline to read sensor data from Pub/Sub, compute the maximum temperature within a time window, and write this out to BigQuery.
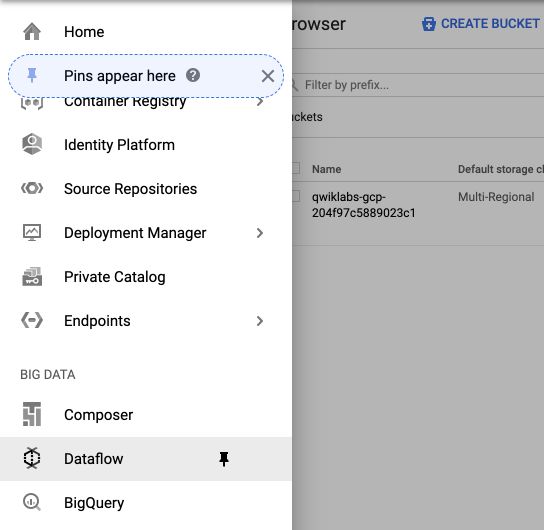
From the navigation menu, click on DataFlow :
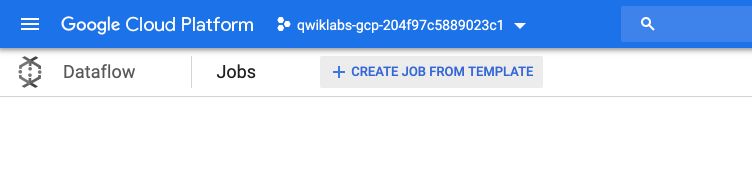
Then, click on “Create job from template” :
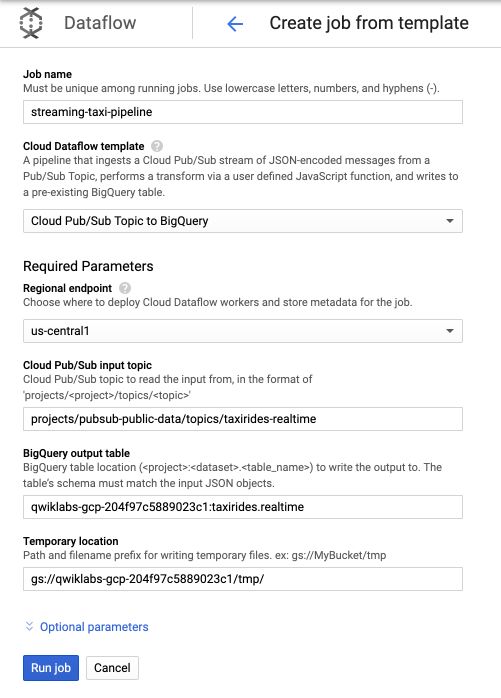
- Under Cloud Dataflow template, select the Cloud Pub/Sub Topic to BigQuery template.
- Under Cloud Pub/Sub input topic, enter
projects/pubsub-public-data/topics/taxirides-realtime - Under BigQuery output table, enter
<myprojectid>:taxirides.realtime - Under Temporary Location, enter
gs://<mybucket>/tmp/
For example :
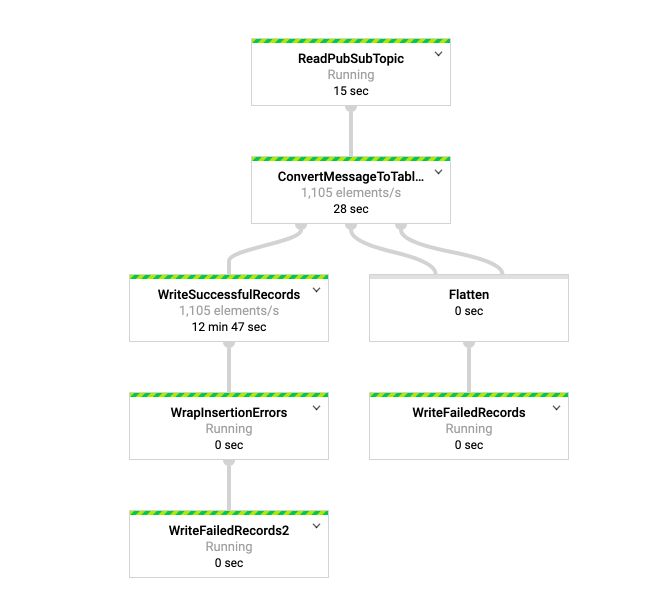
Click on Run job, and you’ll see that your pipeline is now running! The main steps in this template are :
- Read topic
- Convert message to tables
- Write records
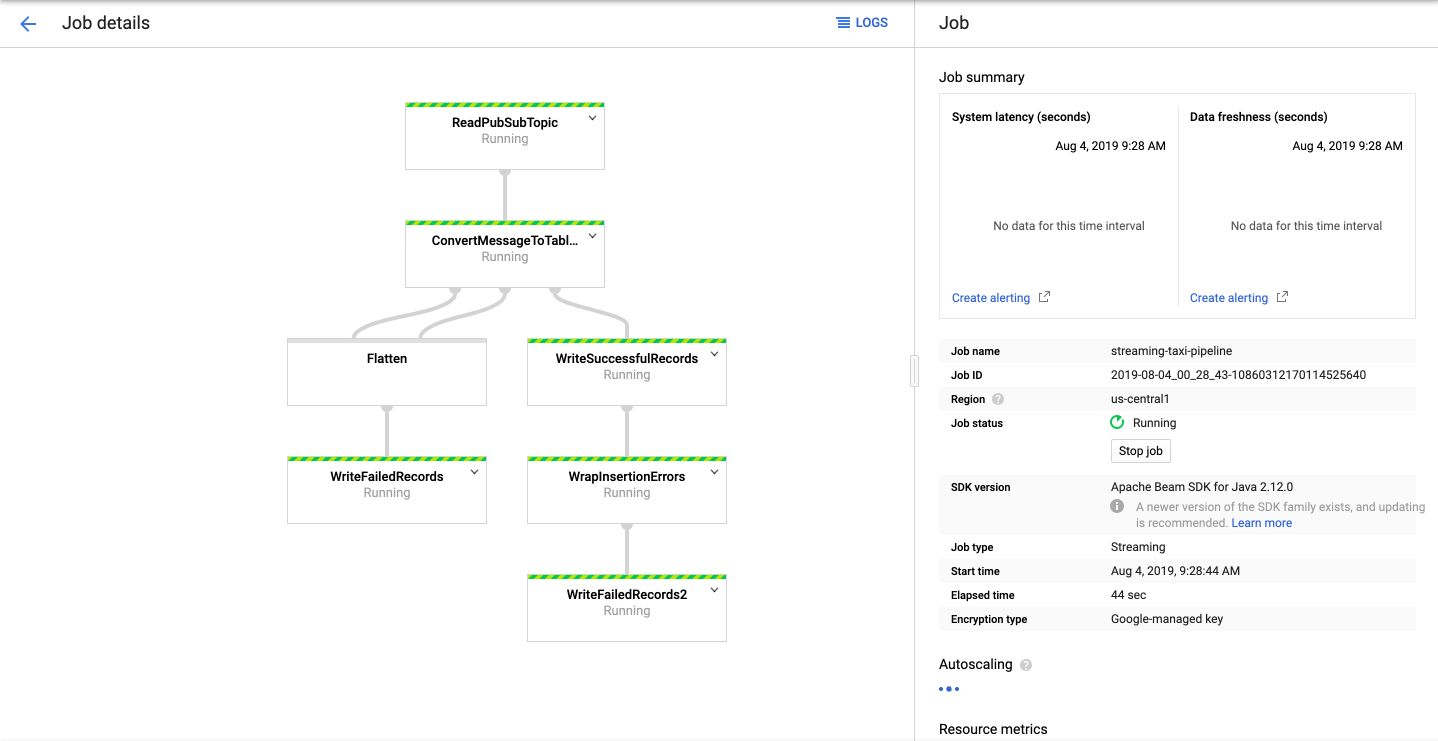
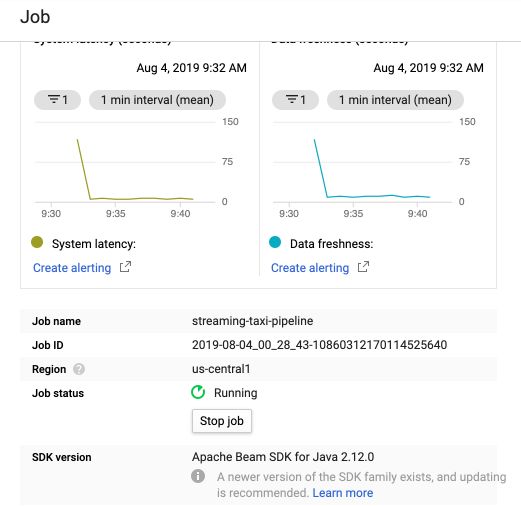
After a few minutes, all services will be up and running, and you should see information on the rate of data coming in :
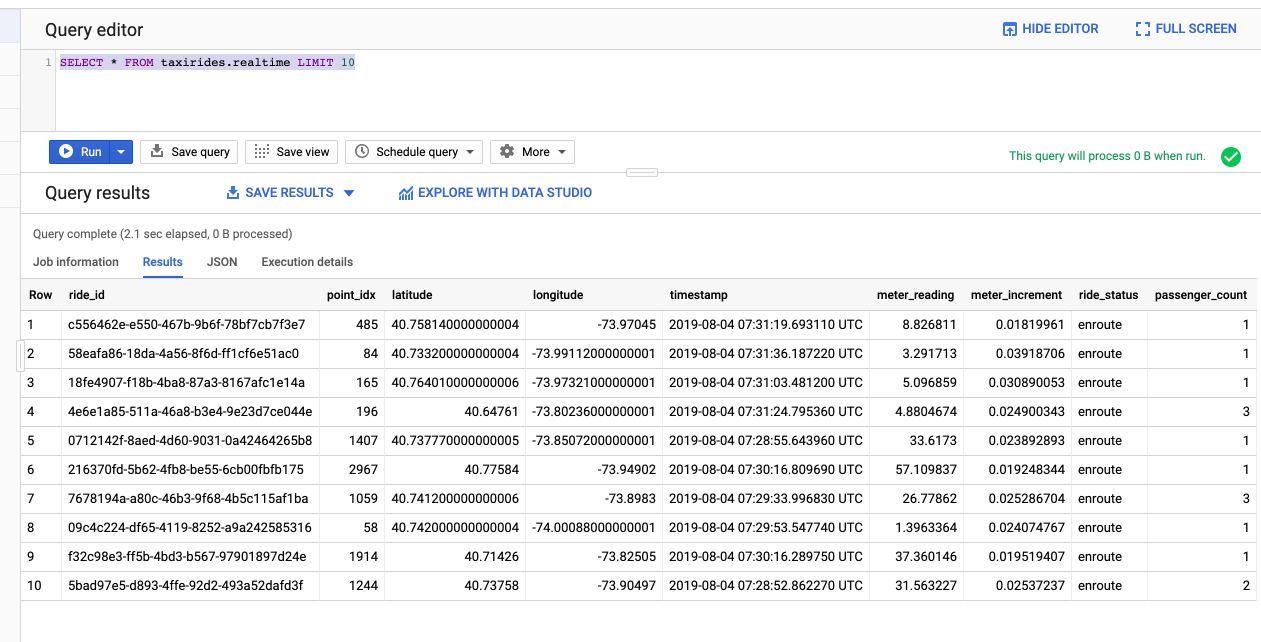
We can now analyze the data in BigQuery :
SELECT * FROM taxirides.realtime LIMIT 10
We can also perform aggregations on the stream for reporting :
WITH streaming_data AS (

SELECT
    timestamp,
    TIMESTAMP_TRUNC(timestamp, HOUR, 'UTC') AS hour,
    TIMESTAMP_TRUNC(timestamp, MINUTE, 'UTC') AS minute,
    TIMESTAMP_TRUNC(timestamp, SECOND, 'UTC') AS second,
    ride_id,
    latitude,
    longitude,
    meter_reading,
    ride_status,
    passenger_count
FROM
    taxirides.realtime
WHERE ride_status = 'dropoff'
ORDER BY timestamp DESC
LIMIT 100000
)

# calculate aggregations on stream for reporting:
SELECT
    ROW_NUMBER() OVER() AS dashboard_sort,
    minute,
    COUNT(DISTINCT ride_id) AS total_rides,
    SUM(meter_reading) AS total_revenue,
    SUM(passenger_count) AS total_passengers
FROM streaming_data
GROUP BY minute, timestamp
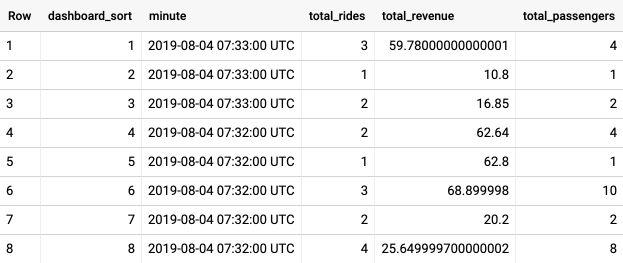
It shows total revenue, customers and rides every minute.
We can now explore this table in Data Studio. Click on “Open with Data Studio”, and we’ll build a small dashboard to display information :
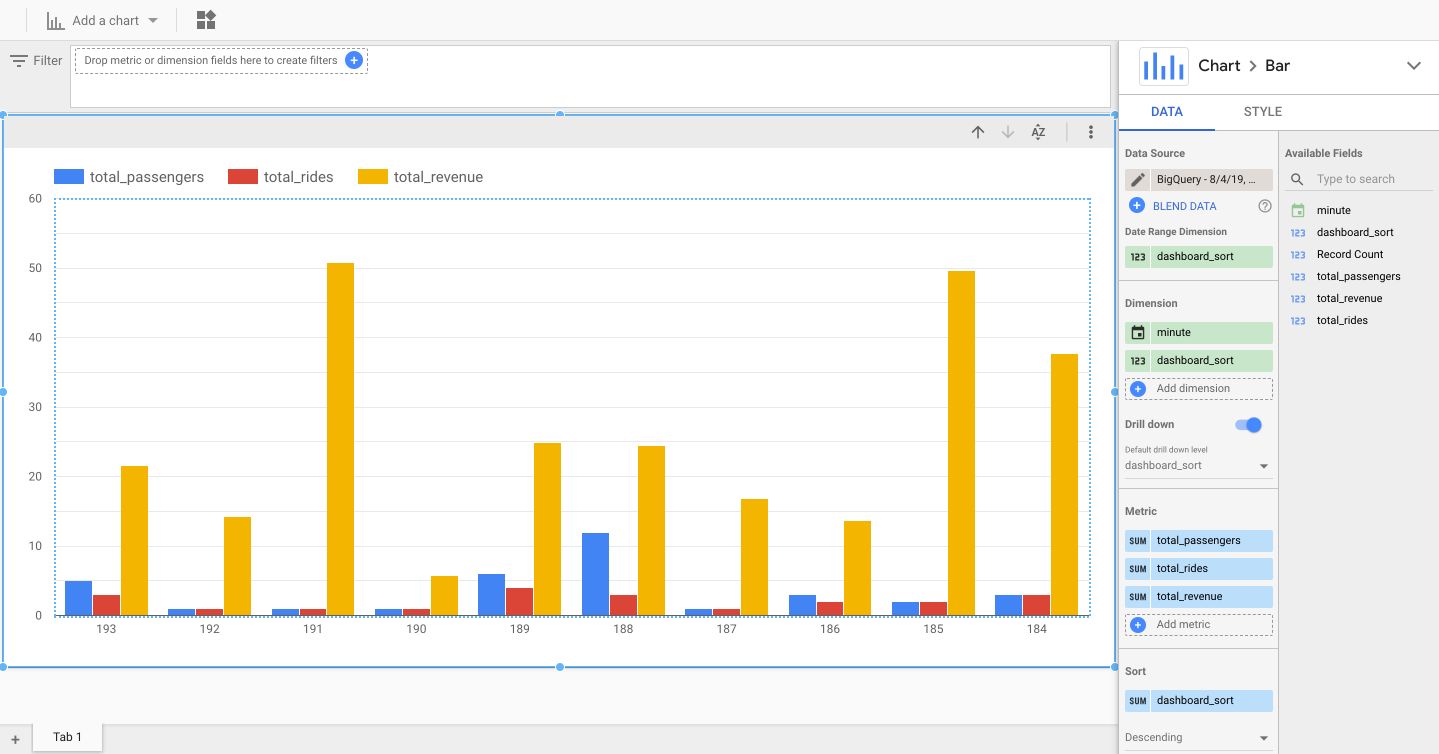
Select the Bar chart option. Set minute as the dimensions as well as dashboard sort, and use the number of passengers, ride, and revenu as metrics.
The data is updated every minute, just click on the button “Refresh Data” whenever you want to visualize the latest data.
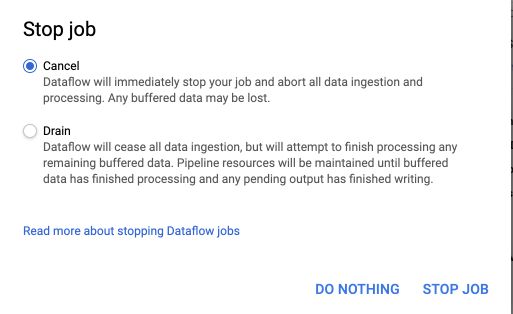
If you want to stop the streaming, stop the job from DataFlow :
And choose to either cancel or drain the ingestion :