
On March 19th, 2019, Neo4J organized an event in Paris. This event was part of the Neo4J GraphTour. Other cities included Milan, TelAvis, Madrid or Berlin for example. Over 3500 people attended the 2019 GraphTour. I’ll present to you the key points covered during the day and some perspectives discussed throughout the day.
I. Impact and future of graphs
Famous graph use cases
You have probably already heard of the Panama papers. This event implied 2.6TB of data, 11.5 million documents, including Emails, Scanned Documents, and Bank Statements… Pretty hard to image a relational database management system (RDBMS) to store and efficiently query all this information. These data have indeed been structured on a Neo4J graph. This had a major impact on the world of finance and offshore companies. This analysis would have not been possible without graph-oriented databases that allow a great data exploration. The graph typically connected an address, to several people and accounts.
Make sure to check this link for the full paper written on Neo4J’s blog.
Graph oriented databases also allow analyzing fake news propagation on social networks during important political events. Neo4J could help to avoid such cases to happen again in the future :
State of the graphs
In 2014, Forrester predicted that 25% of enterprises would be using graph databases in 2017. As of today (2019), more than 50% of enterprises are using graph databases. Close to 70% of enterprises have or are planning to use graph databases. 76% of Fortune 100 use graph databases.
DB engines (insert image) shows that the interest in graph databases has been growing way above any expectation.
- 7 of the Top 10 Software companies use Neo4J, including Microsoft, eBay…
- 8 of the Top 10 Insurance companies use Neo4J for fraud detection for example…
- Over 800 startups use Neo4J
Neo4J has over 10 million downloads. Over 50’000 people have been trained and certified Neo4J professionals. Now, you should pretty much be convinced that Neo4J is something pretty big.
When should you use graphs?
Graphs should be used when one of these three criteria is met :
a. Complex environment
Volva uses Neo4J for car manufacture. Is a car a complex environment ?
- 30’000 pieces
- 200 computation units
- 100 communication buses
- 2000 software components
- 10000 signals
- …
There is a large variety of data sources, coming from different software…
We need to overcome the “accidental” complexity, that exists due to incoherence between the need and the tools. We need to focus on the essential complexity, i.e find a solution that fits the needs of the company.
A Neo4J project should be implemented step by step. There is an option to load data as native graph data from a SQL database. Then, over time, add new data of new sources and types. There is no need to define the schema at first, so the upload of the data is simple.
b. Need for flexibility
NASA uses a knowledge graph database in their documentation. This provides results way more interesting than classical keyword detection for example.
c. Need for performance
In a native graph architecture, data are computed to be stored only once. Then, any query is a simple read of the data. Marriott offers over 300M dynamic pricing operations per day. Queries during Cyber Mondays are executed in less than 4ms.
Let’s be concrete. What are the most common use cases?
- Social Media and social networks
- Telecommunication network
- Real-time recommendation (Retail)
- Fraud detection (Insurance)
- Network management & IT
- Master data management
- Knowledge graphs (Large documentation e.g NASA)
- Access control (Bank)
- Dynamic pricing
- IoT applications
- Supply chain efficiency
- …
A quick history of the development of graphs
The first wave of development of graph technologies was graph applications. Altavista and Lycos disappeared, and Google has since then been rising, using graph search. Monster.com was also replaced LinkedIn, which is using graph technologies too.
The second wave, in which we currently stand, is graph platform. Graph platform is a result of the fact that more and more applications are connected, and more data are being collected. Within a company, several graphs built. Nowadays, companies tend to build graph networks to connect their different connected data. Neo4J launched Neo4j Bloom that gathers :
- perspective
- visualization
- exploration
- inspection
- editing
- search
The latest trends include graph algorithms for community detection for example or Cypher for Apache Spark. Make sure to check these great resources uploaded by Neo4J.
The third wave is the Graph-Enabled and Graph-Enhanced AI. We are about to face a revolution in the graph industry. The different upcoming technologies include :
- evidence-based
- ML systems
- Natural Language Generation
- …
Graph provides connections and context for AI. A simple graph (Person, drive, born in, loves, married …) can teach us a lot about a single individual. Relationships are often the strongest predictors of Behavior.
The 4 pillars of Graph-Enhanced AI are :
- Knowledge graphs (chatbots, NLP…)
- Connected features add context to ML for improved accuracy
- Filtered Connected Features target some parts of the knowledge graph to improve accuracy and speed
- Explainability and Credibility of algorithms are enhanced when we use graphs
Who is Neo4J made for?
The main users of connected data are :
- data scientists: sentiment analysis, customer segmentation, machine learning, cognitive computing, community detection…
- applications: fraud detection, recommendations, master data management…
- business users: discovery and visualization for fraud detection, product information management, risk, and portfolio analysis…
In summary, pretty much anyone who can gain insights from the company’s data.
II. Main features of Neo4J
Properties
40 years ago, in 1979, the best storage was still paper forms. The first Relational Database Management System was born at that time. Nowadays, thanks to abundant RAM, Flash & IO Co-processors, we have a high capacity and high-speed storage opportunity.
From an IT perspective :
- traditional databases are used to store and retrieve data in real-time
- big data technology is used to aggregate and filter data (Hadoop, Spark..)
- graph technologies are used to explore connections in data
Neo4J offers index-free adjacency. At write time, data is connected as it is stored. At read time, queries for data retrieval are up to 1’000x faster while using 10x fewer servers. Above 3 nodes and 2 to 3 connected for each, the queries are already faster.
ACID properties are required for graph transactions. This is called a graphing unit of work. ACID consistency guarantees that the whole transaction is a success, otherwise it fails. Data replicated across the cluster should also always be similar on each node, to guarantee the consistency. Neo4J has ACID properties of RDBMS with the speed of NoSQL technologies.
Cypher Query Language, the language to make queries in Neo4J, is also easy to read, and way more compact that SQL from example when we explore relations. Cypher is an open-source project that can be used for all graph databases.
The foundational components of Neo4J are :
- Index-Free adjacency
- ACID Foundation
- Full-Stack clustering
- Language, Drivers, Tooling
- Graph Engine
- Hardware Optimization
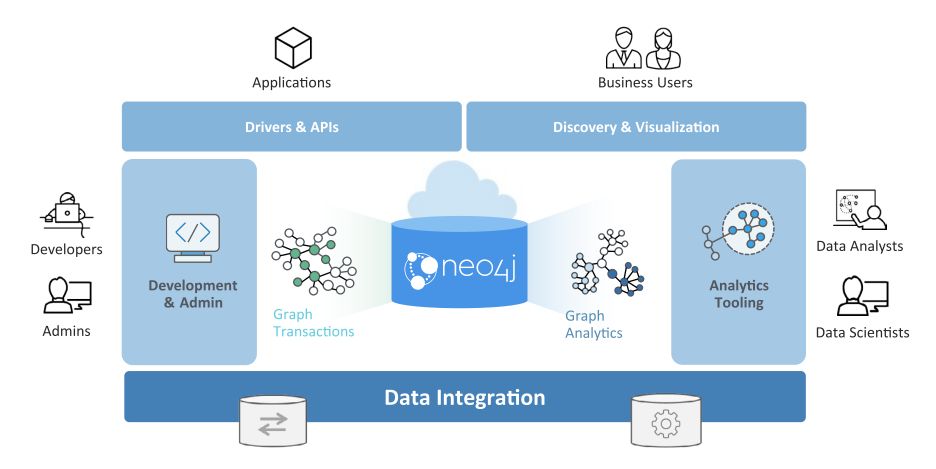
Neo4J graph platform includes :
- drivers and APIs
- discovery and visualization
- development and administration
- neo4j database, transaction, and analytics
- analytics tooling
- data integration
Visualization
How can we visualize graphs in Neo4J?
- In Bloom, provided by Neo4J, near-natural language search, for individual and small team use
- In Graph Viz Solutions using Linkurious or Tom Sawyer for a small team and departmental or cross-departmental use
- BI Tools such as Tableau and Qlik, but that are not optimized for graph data and may require special connectors
- In Viz Toolkits (d3.js for example) for a custom solution that requires more development
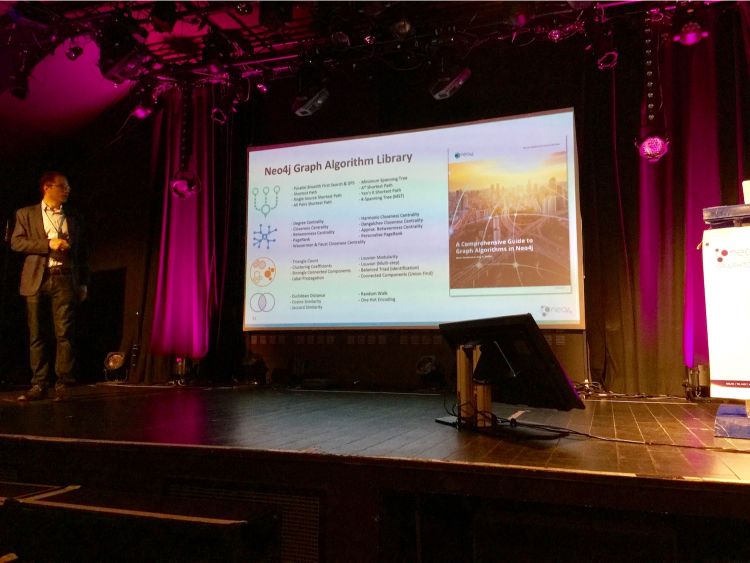
Algorithms
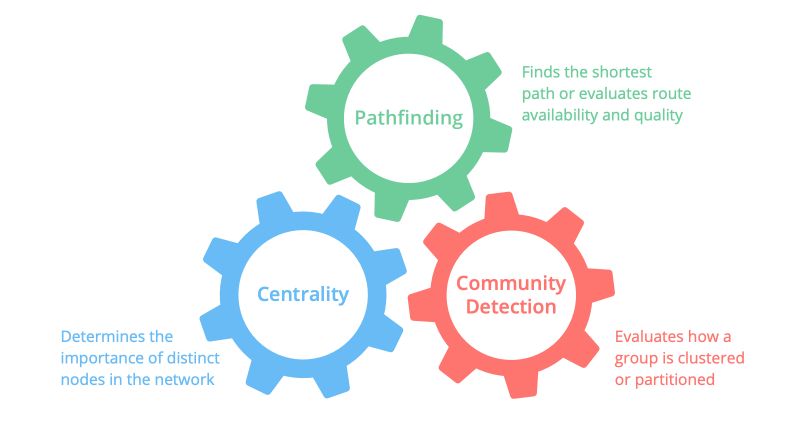
Three categories of algorithms have been implemented :
- pathfinding and search: find the optimal path, evaluated route availability, and quality
- centrality: determines the importance of distinct nodes in the network (e.g PageRank of Google)
- community detection: evaluates how a group is clustered or partitioned
Latest features
Neo4J 3.5 added :
- full-text search
- Go-driver
- New graph algorithms
- Enhanced performance and security
**Conclusion **: Many other topics and use cases were covered throughout the day. I can only but recommend you to attend the GraphTour! I hope this article gave you a quick idea of what you can expect from the day. Don’t hesitate to drop a comment if you have a question.