

I. Cloud solution
The ElasticCloud is a fully managed service for both Kibana and Elasticsearch. It allows one-click install and easy upgrades. It also gives a nice UI for Elasticsearch clusters. The solution is free for a 14 days trial. Some customers of Elastic Cloud include Sprint, Verizon, eBay or Dell.
1. Elasticsearch
First of all, create an account here and log-in to the console. You should see something like this :
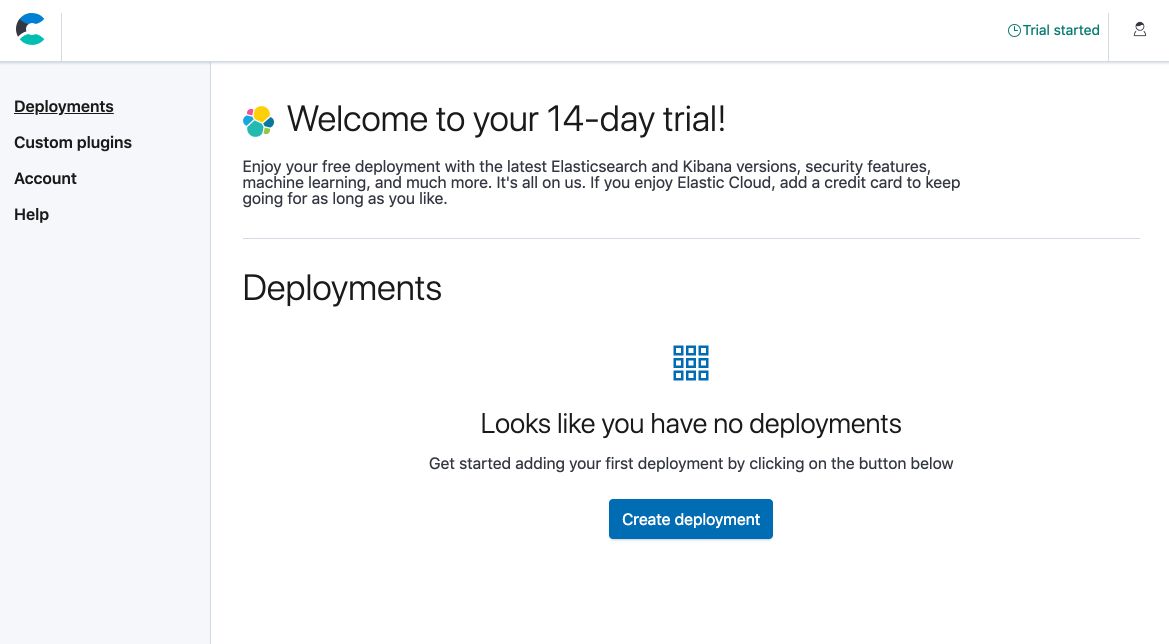
We’ll now create a cluster with Elastic Cloud in under 3 minutes. You can get started without a credit card during the first 14 days. The trial version comes with :
- 8GB RAM
- 240GB storage
- High availability over 2 zones
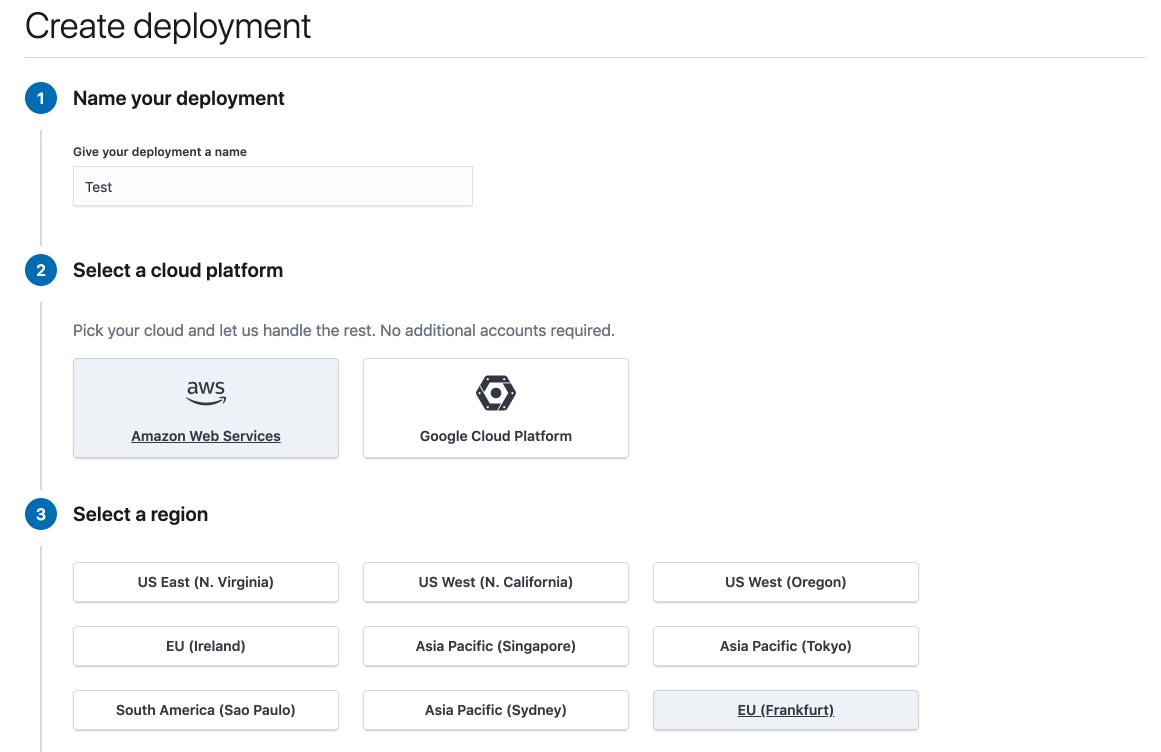
Click on “Create Deployment”.
- Give your deployment a name
- Select a cloud platform among AWS or GCP
- Select a region
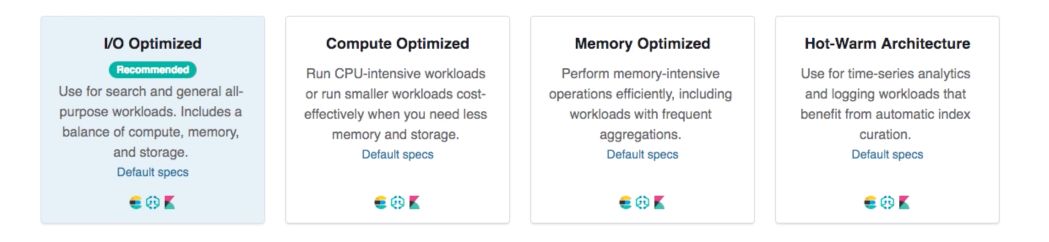
- Choose a deployment template among the ones proposed
- Click on “Customize Deployment”
Among the proposed templates, some are optimized for aggregations in RAM, others for time series…
Once on the customization menu, navigate through the page to see which options you have access to. Everything is pretty intuitive, and adding capacity or enabling services is quite simple. Most menus are however locked since you currently have a trial account.
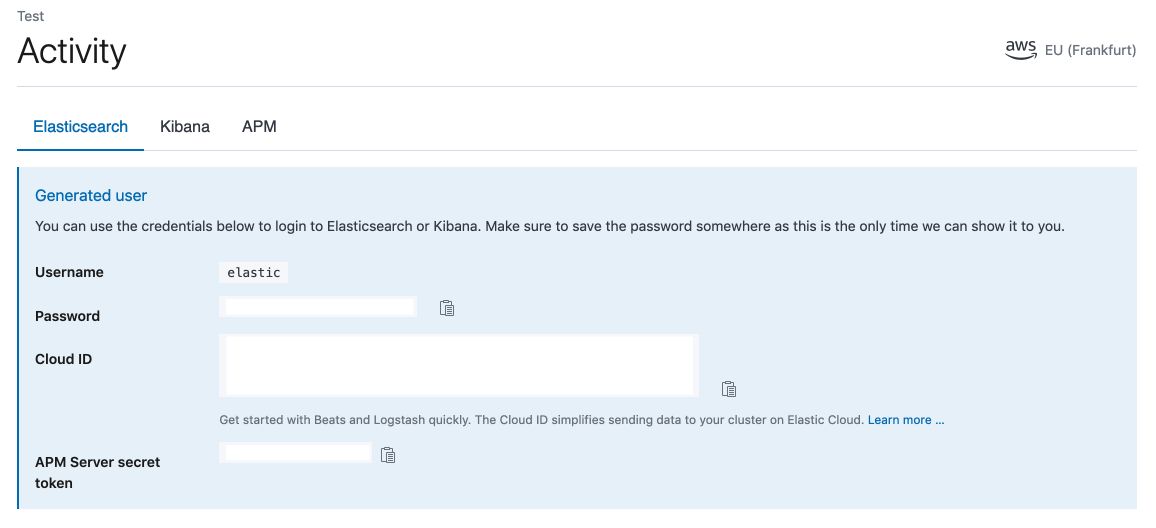
Then, click on “Create Deployment”.
You’ll land on the Activity Page. It might take a few minutes for the clusters to be up and running. Make sure to save the password given, as there won’t be any way to retrieve it later on.
2. Kibana
Now, in the menu on your left, click on the Overview Page, and launch Kibana service :
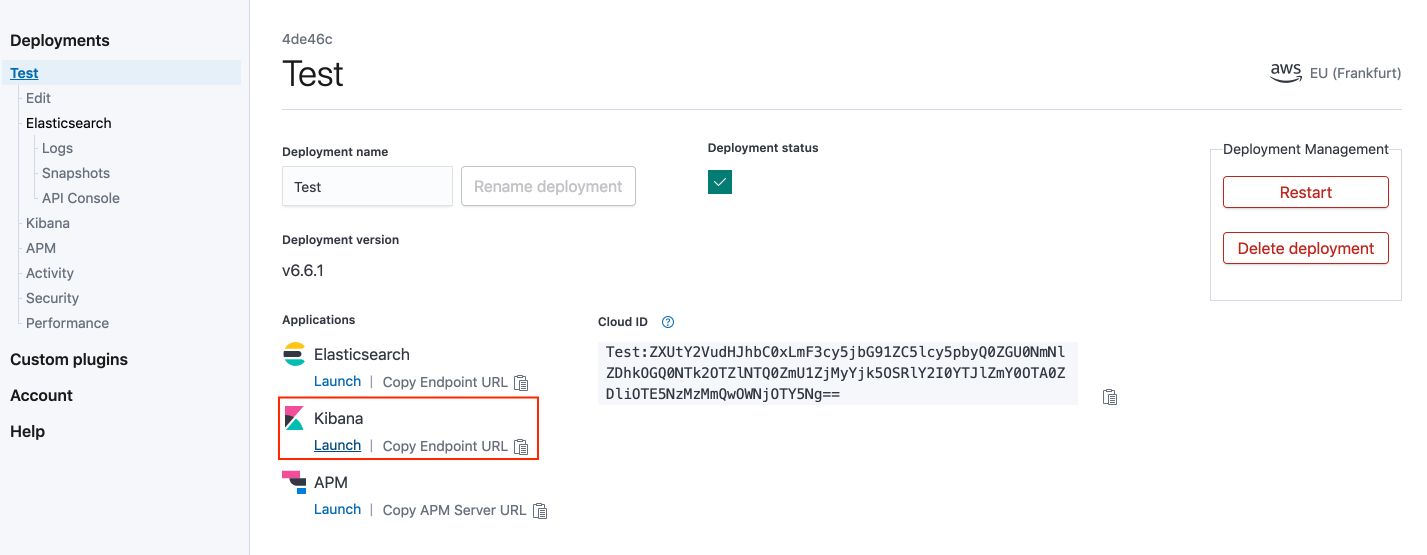
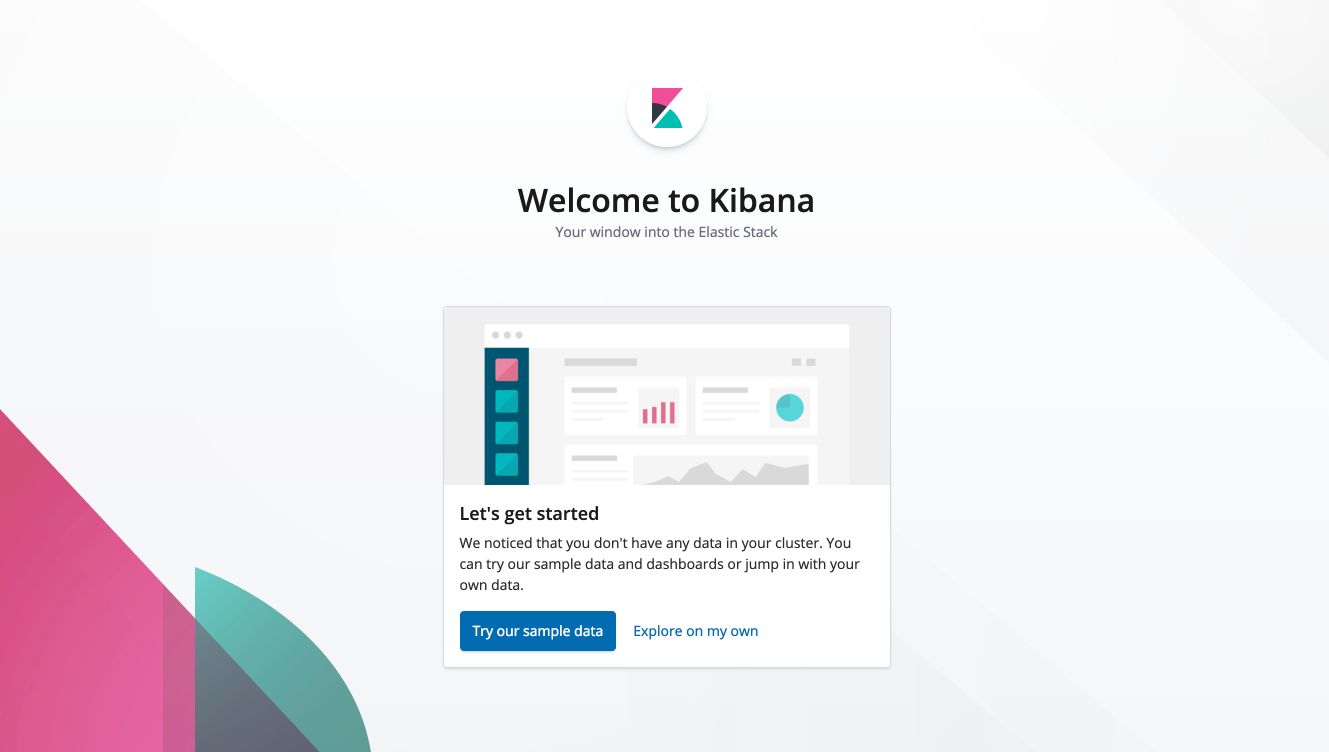
Log-in to Kibana using the default user name elastic and the password that you saved in the Activity section. Click on “Explore on my own”.
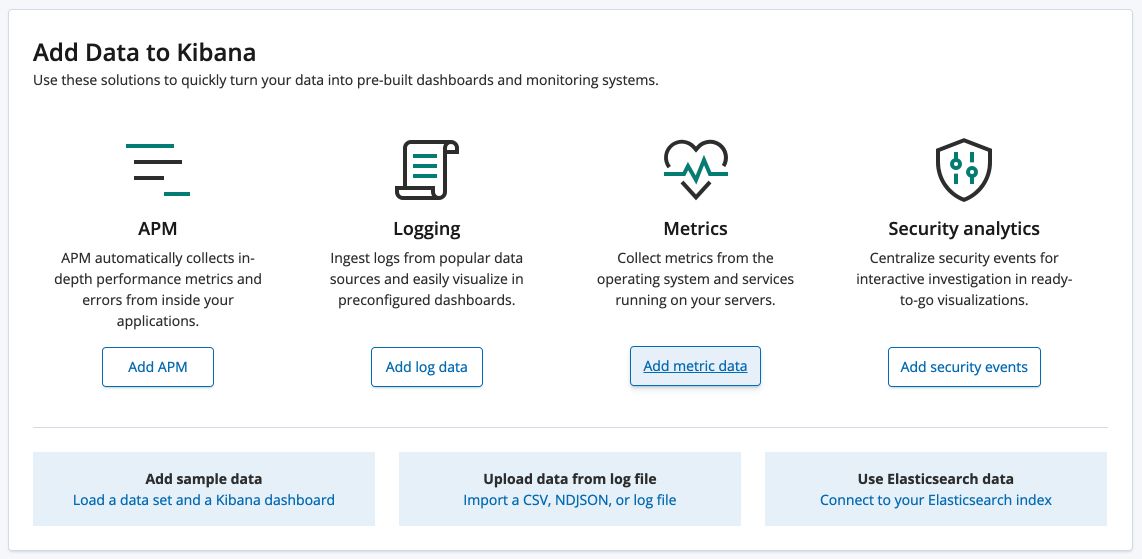
In this tutorial, we’ll cover a basic example of retrieving the system metrics of your local machine into Kibana. In the “Add Data to Kibana” section, click on Metrics. This can typically be used to collect metrics from the operating system and services running on your servers or your local machine.
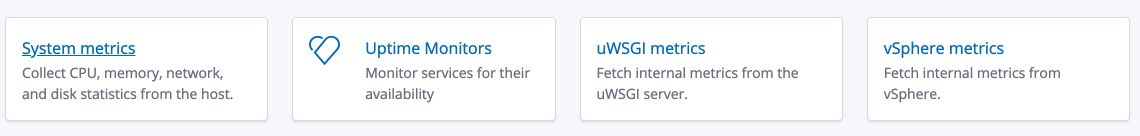
Scroll down, and click on “System metrics”.
I’m on macOS, so I’ll just follow the small tutorial for macOS :
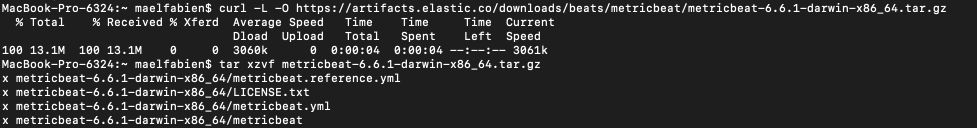
Step 1 : Download and install MetricBeat
Copy the code snipet :
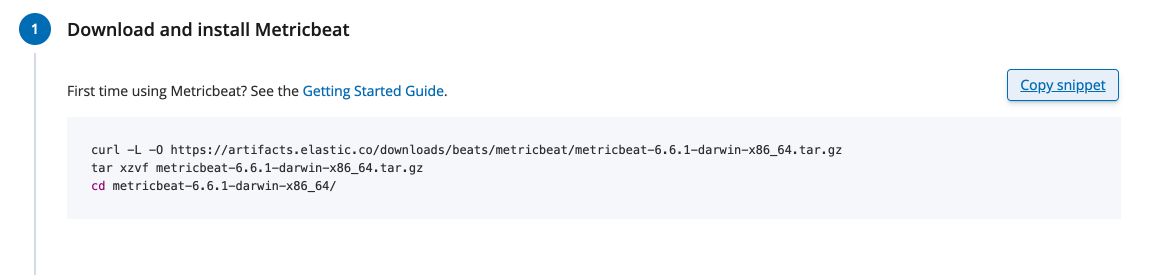
Paste this code in your default directory in your terminal.
Step 2 : Edit the configuration file
Modify metricbeat.yml to set the connection information for Elastic Cloud. In your terminal, type :
vim metricbeat.yml
The metricbeat.yml will open. To start editing the file, type the letter i (for insert). Copy-paste the code snippet in the Elastic Cloud section :
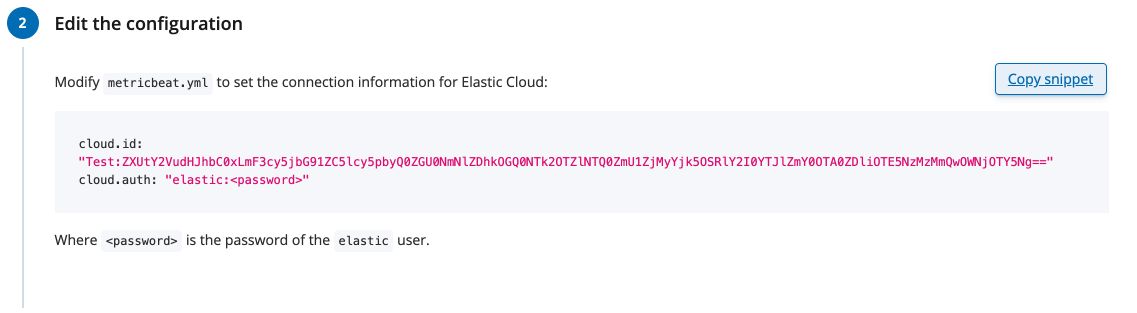
Make sure to replace the <password> section by the password you copy-pasted from the Activity section before.
#============================= Elastic Cloud ==================================
cloud.id: "Test:ZXUtY2VudHJhbC0xLmF3cy5jbG91ZC5lcy5pbyQ0ZGU0NmNlZDhkOGQ0NTk2OTZlNTQ0ZmU1ZjMyYjk5OSRlY2I0YTJlZmY0OTA0ZDliOTE5NzMzMmQwOWNjOTY5Ng=="
cloud.auth: "elastic: PASTE YOUR PASSWORD HERE"

# These settings simplify using metricbeat with the Elastic Cloud (https://cloud.elastic.co/).
We are still using the default user. We’ll see later on how to create a user and attach rights to it. To save and quit the file, press ESC, and type :wq.
Step 3 : Enable and configure the system module
Simply run the following command in the folder you installed MetricBeat in :
./metricbeat modules enable system
Step 4 : Start Metricbeat
Then, load the Kibana dashboards in your terminal :
./metricbeat setup
You should see this:
Loaded index template
Loading dashboards (Kibana must be running and reachable)
Loaded dashboards
Finally, run this command :
./metricbeat -e
Make sure that the data is received using the “Check Data” button :
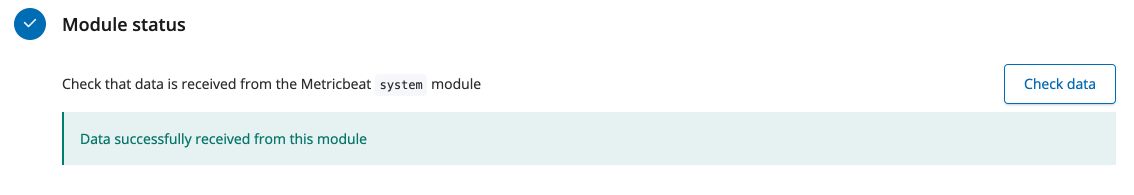
You’re now ready! Move on to the next step.
You now have metrics data from your local machine flowing into Kibana.
3. Exploring Kibana
We’ll now go over the different sections of Kibana while our data keeps flowing in.
a. Discover
If you’re familiar with Tableau software, you’ll notice how easy to use this section is. The graph presents the count of data coming in every 30 seconds. 90 to 100 new data are added every 30 seconds so that around 180 to 200 data point per minute.
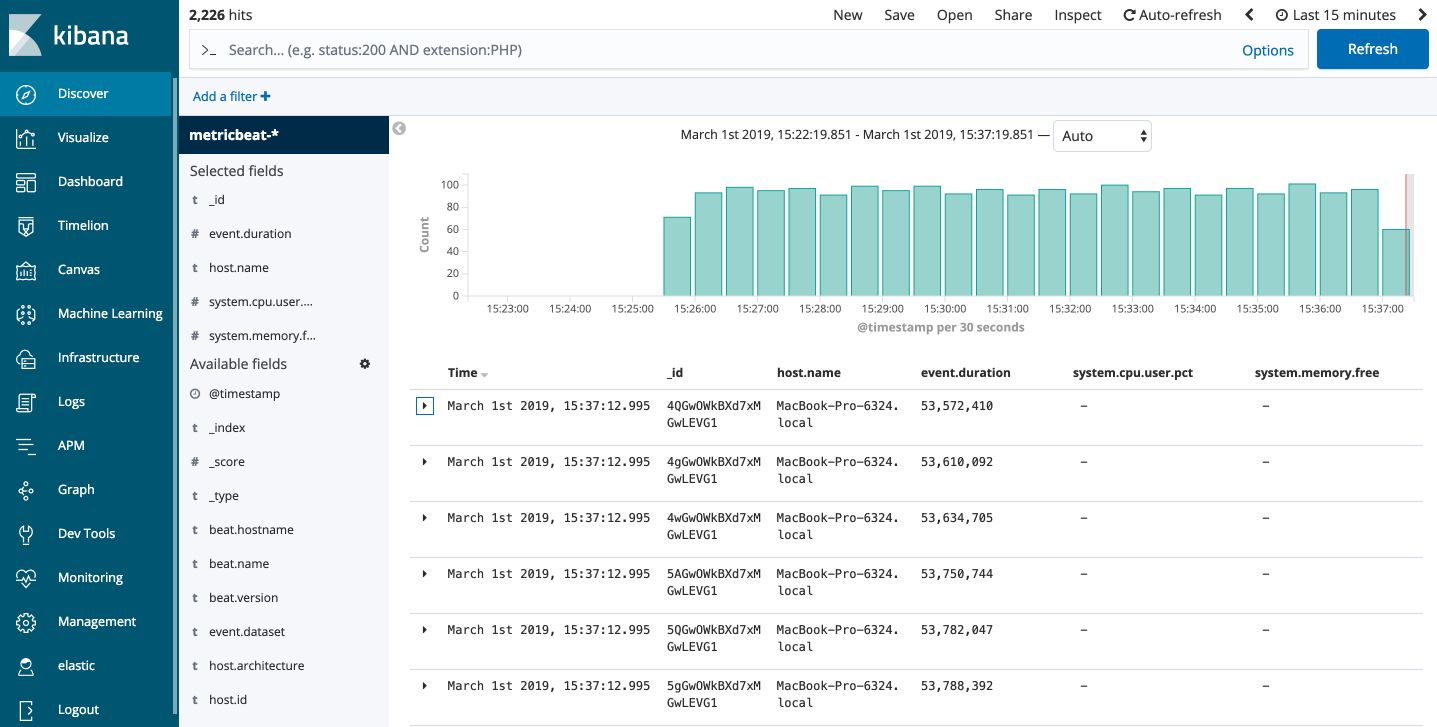
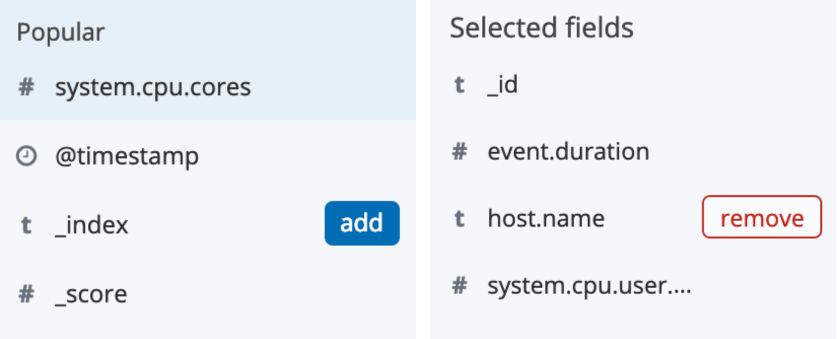
You can add or remove fields to explore on the side menu, using the “Add” or “Remove” button.
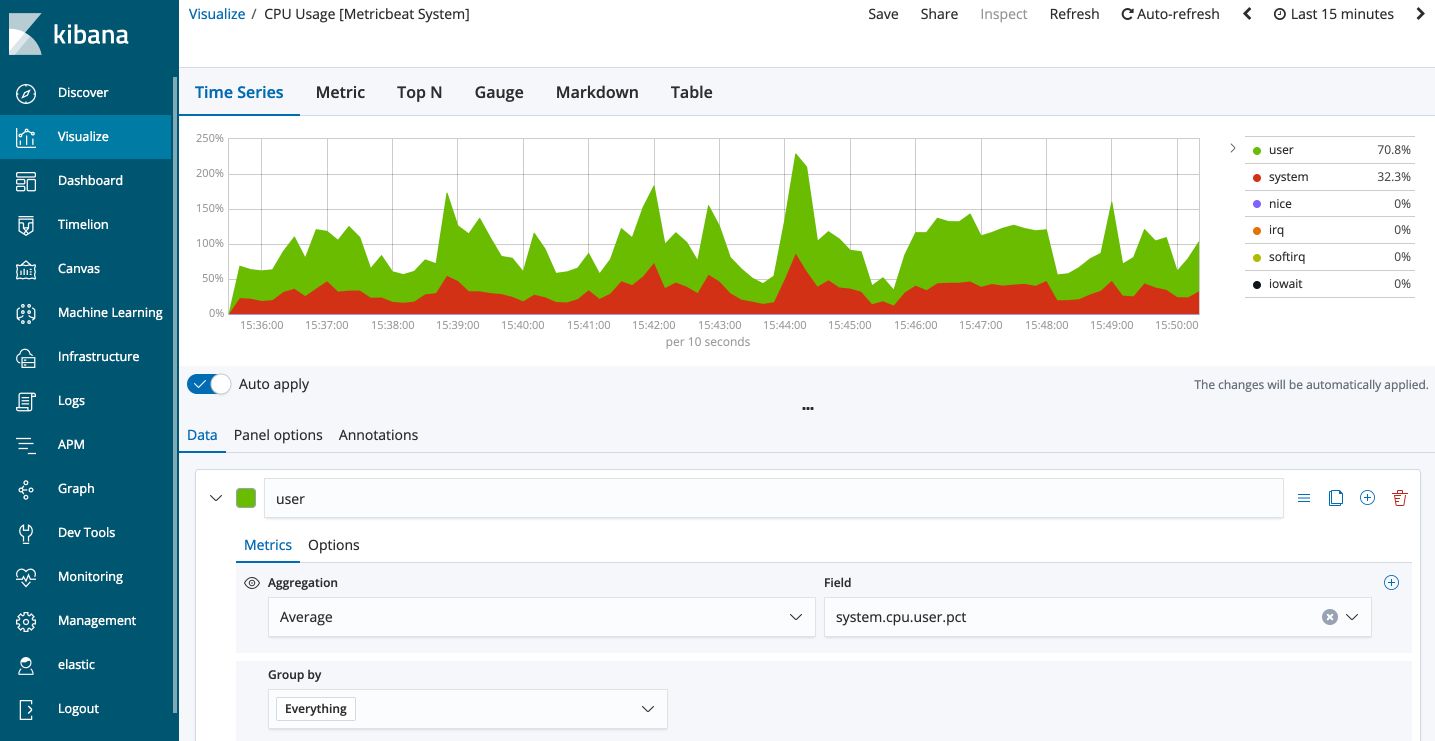
b. Visualize
The “Visualize” menu displays some pre-built views to explore your data depending on the most common use cases, including for example :
- command rates
- average response time
- average time in the queue
- …
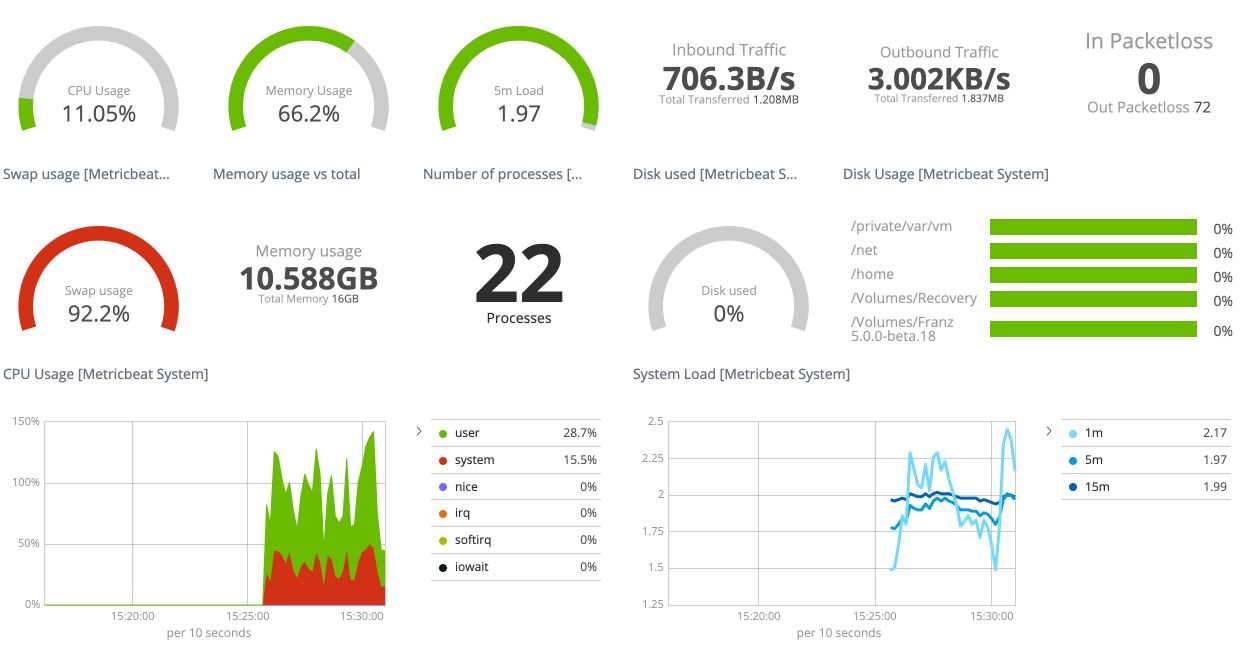
For example, type “System” in the research menu and select CPU Usage [Metricbeat System]. You’ll have access to a pre-built dashboard that displays a time series of your CPU usage.
c. Dashboard
The dashboard looks like this :
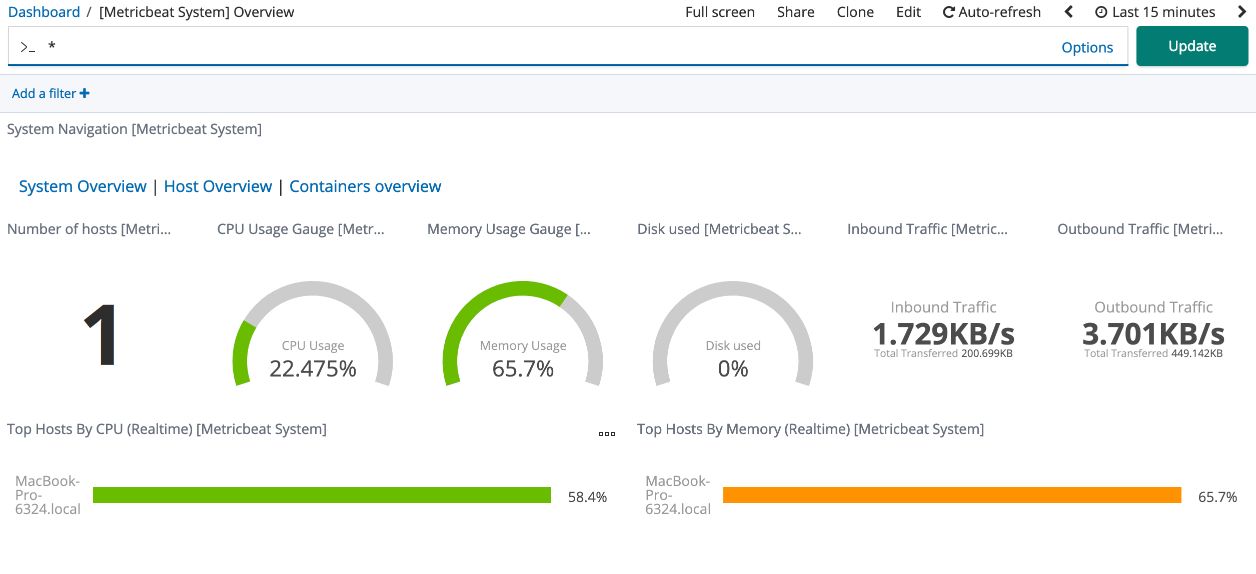
You can use the “Host overview” tab to visualize some more data. The dashboard is made of modules that present the data in a clear and easy to understand way.
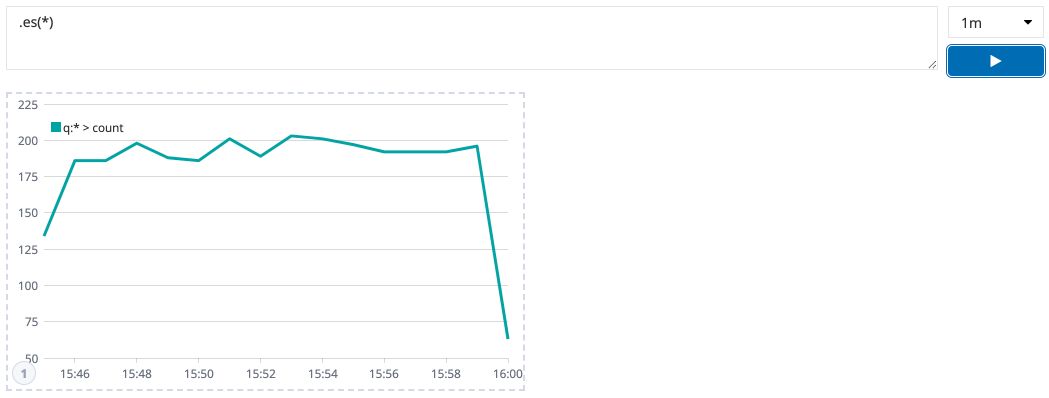
d. Timelion
“Timelion is the clawing, gnashing, zebra killing, pluggable time series interface for everything. If your datastore can produce a time series, then you have all of the awesome power of Timelion at your disposal. Timeline lets you compare and combine datasets across multiple data sources with one easy-to-master expression syntax. This tutorial focuses on Elasticsearch, but you’ll quickly discover that what you learn here applies to any data source Timelion supports.”
We’ll try to see how to use Timelion for the number of data points received every minute for example.
Explore the function reference to see which functions are available. For example, if we are interested in the first difference of the number of data points received every minute :
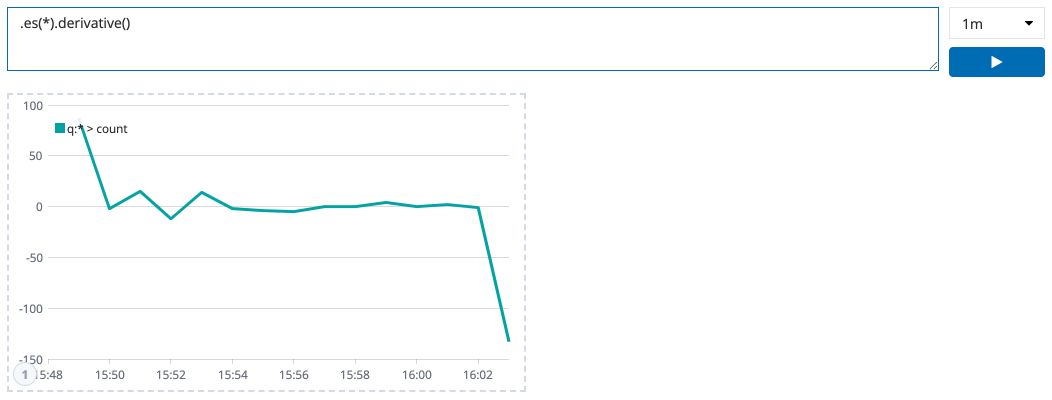
The drop in the number of points is because the minute of collecting data is not over yet.
e. Canvas
The canvas is an amazing way to build nice-looking dashboard intuitively. It’s a Drag&Drop for data visualization.
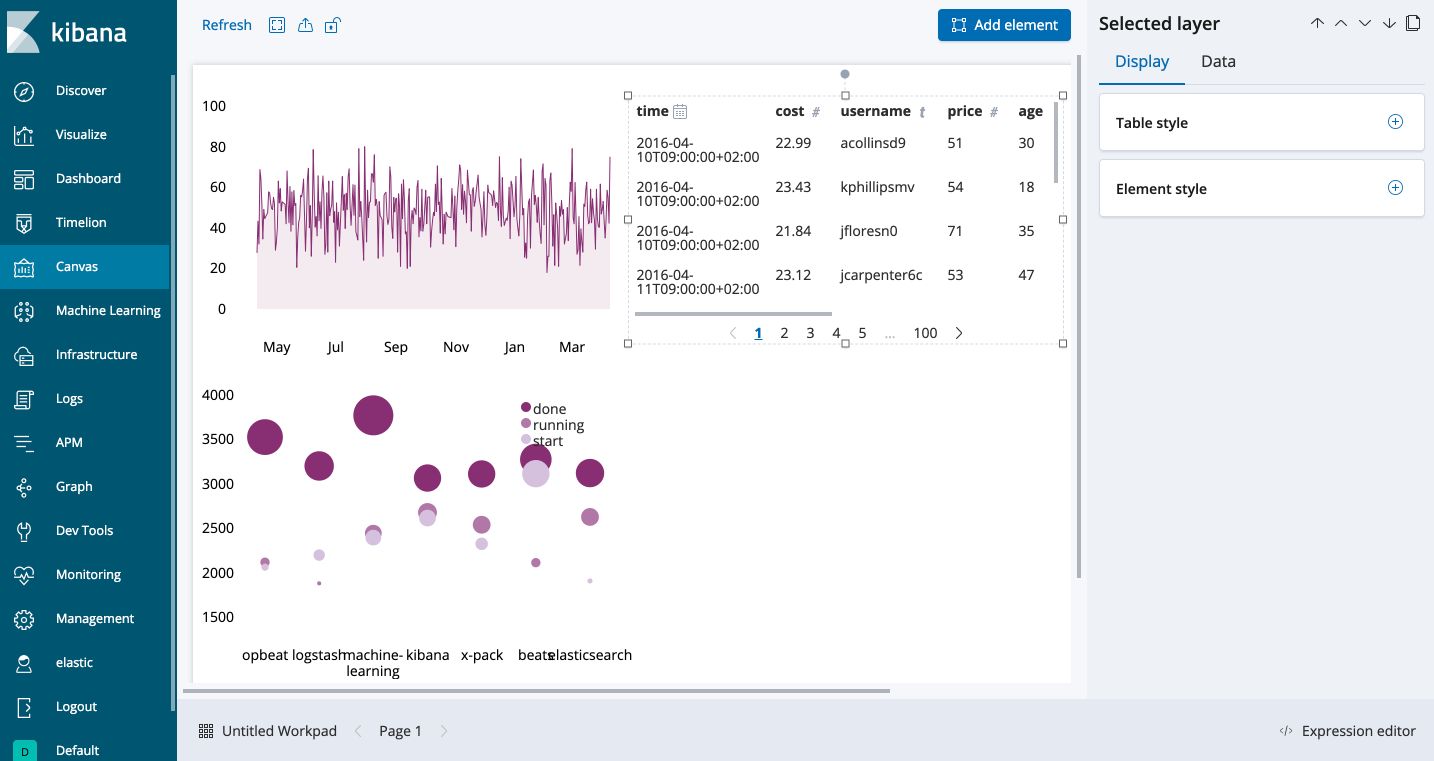
Here, I’m using the sample data Kibana provides. You can connect several data sources on the same dashboard, add pictures, several types of graphs, metrics…
This is still a Beta functionality while I’m writing this, but the service will become a standard shortly.
f. Machine Learning
I won’t go into the details of the section, I’ll make a dedicated article on this subject.
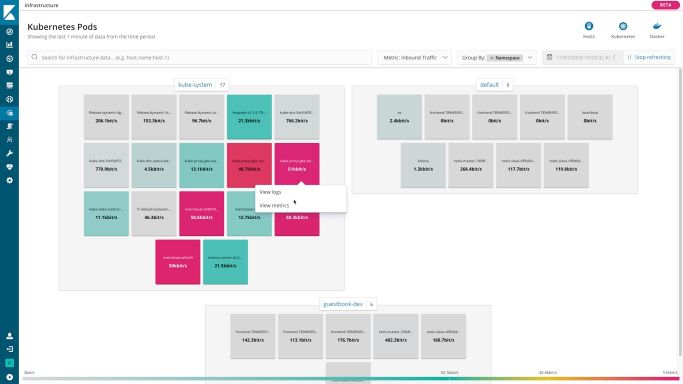
g. Infrastructure
This section is really useful to monitor your infrastructure and identify problems in real-time. You can explore logs, containers, and services. Since we have only one machine connected, I’ll display a dashboard of a real infrastructure that allows detecting anomalies.
h. Logs
We don’t have any logging indices for the moment. We’ll follow the tutorial to add some (here, for macOS).
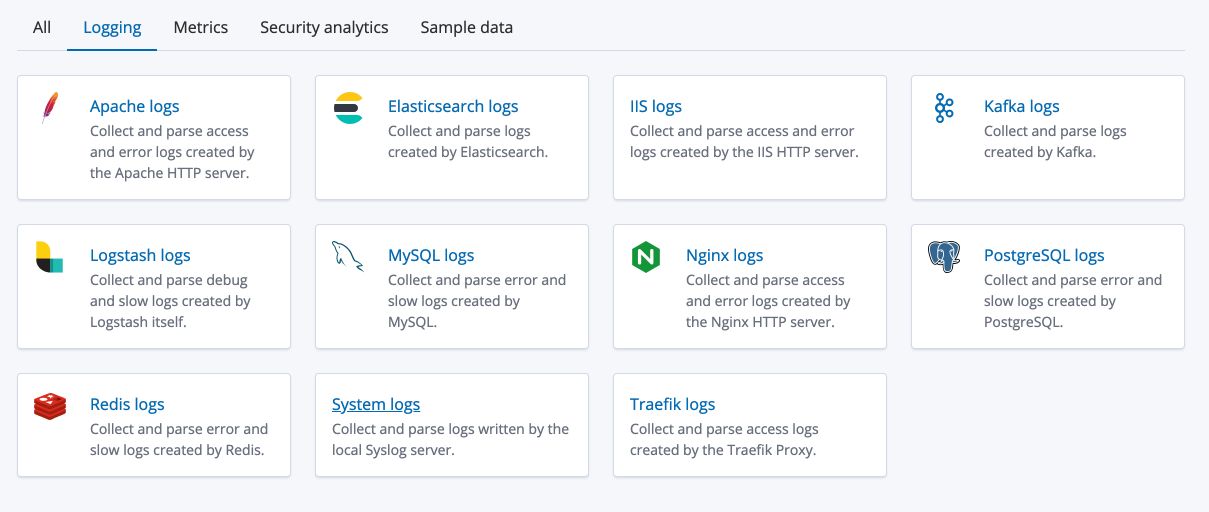
Step 1 : Download and install Filebeat Paste the following code in your default directory in your terminal :
curl -L -O https://artifacts.elastic.co/downloads/beats/filebeat/filebeat-6.6.1-darwin-x86_64.tar.gz
tar xzvf filebeat-6.6.1-darwin-x86_64.tar.gz
cd filebeat-6.6.1-darwin-x86_64/
Step 2 : Edit the configuration
Modify filebeat.yml to set the connection information for Elastic Cloud:
vim filebeat.yml
Paste the code snippet :
#============================= Elastic Cloud ==================================
cloud.id: "Test:ZXUtY2VudHJhbC0xLmF3cy5jbG91ZC5lcy5pbyQ0ZGU0NmNlZDhkOGQ0NTk2OTZlNTQ0ZmU1ZjMyYjk5OSRlY2I0YTJlZmY0OTA0ZDliOTE5NzMzMmQwOWNjOTY5Ng=="
cloud.auth: "elastic:PASTE YOUR PASSWORD HERE"
# These settings simplify using filebeat with the Elastic Cloud (https://cloud.elastic.co/).
We are still using the previous password for the default user. To save and quit the file, press ESC, and type :wq.
Step 3 : Enable and configure the system module
From the installation directory, run :
./filebeat modules enable system
Step 4 : Start Filebeat
Finally, start Kibana dashboards and start filebeat using :
./filebeat setup
./filebeat -e
If the installation process worked successfully, you should see something like this :
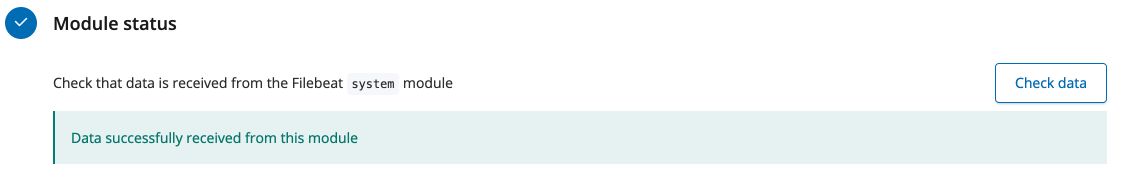
You should now be able to see all the logs from your Log section on Kibana!
i. APM
Application Performance Monitoring (APM) collects in-depth performance metrics and errors from inside your application. It allows you to monitor the performance of thousands of applications in real-time. Since we don’t have any app yet, we won’t cover this part.
j. Graph
If your data involve a network, it might be nice to represent them as graph data. This section will be doing it for you.
k. Devtools
Devtools contains development tools that you can use to interact with your data in Kibana.
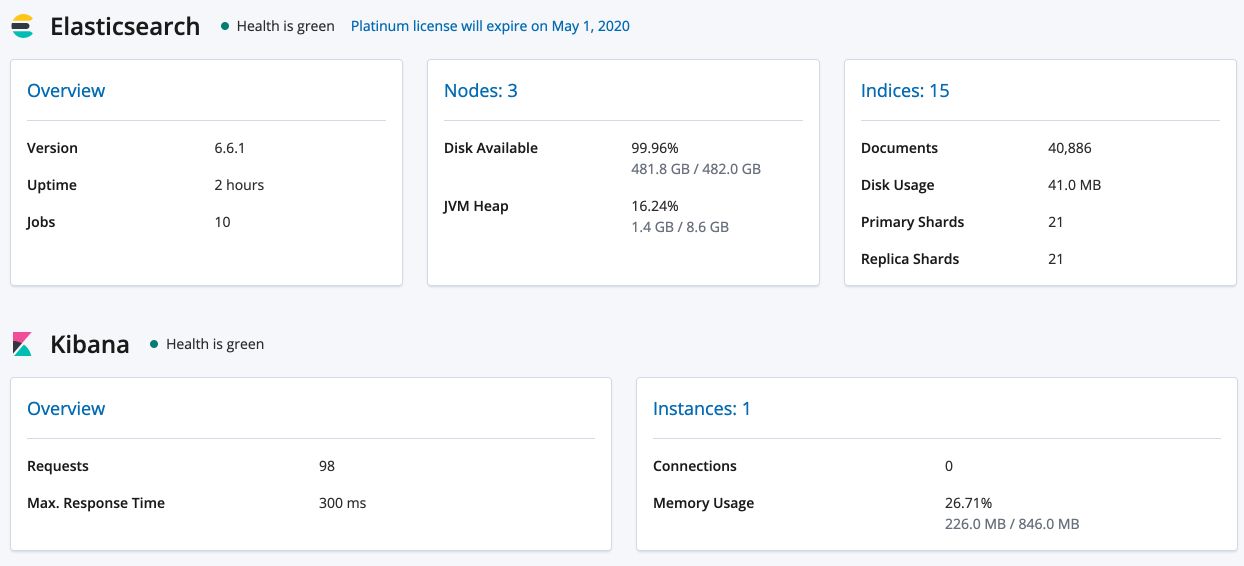
l. Monitoring
The monitoring can be used to check that your services are up and running :
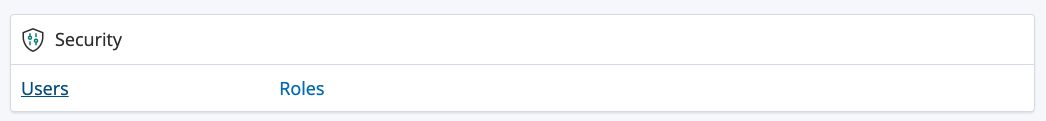
m. Management
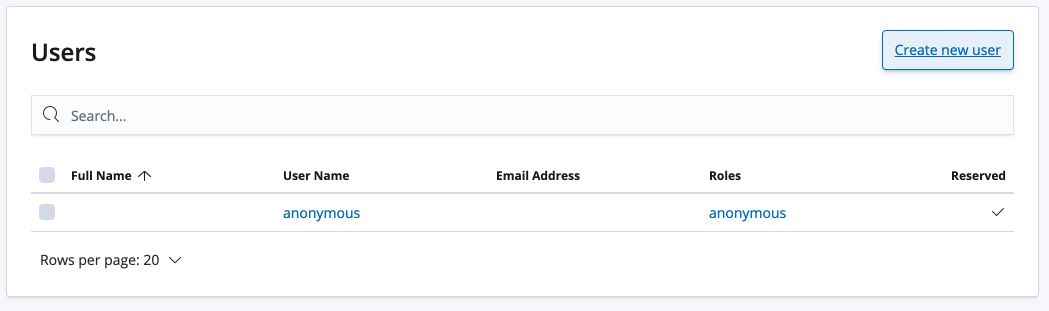
Now, suppose we want to create another user. Go to the management section, and click on “Users”.
Then, click on “Create New User” :
Fill in the form, and give the user the specific access you’d like him to have :
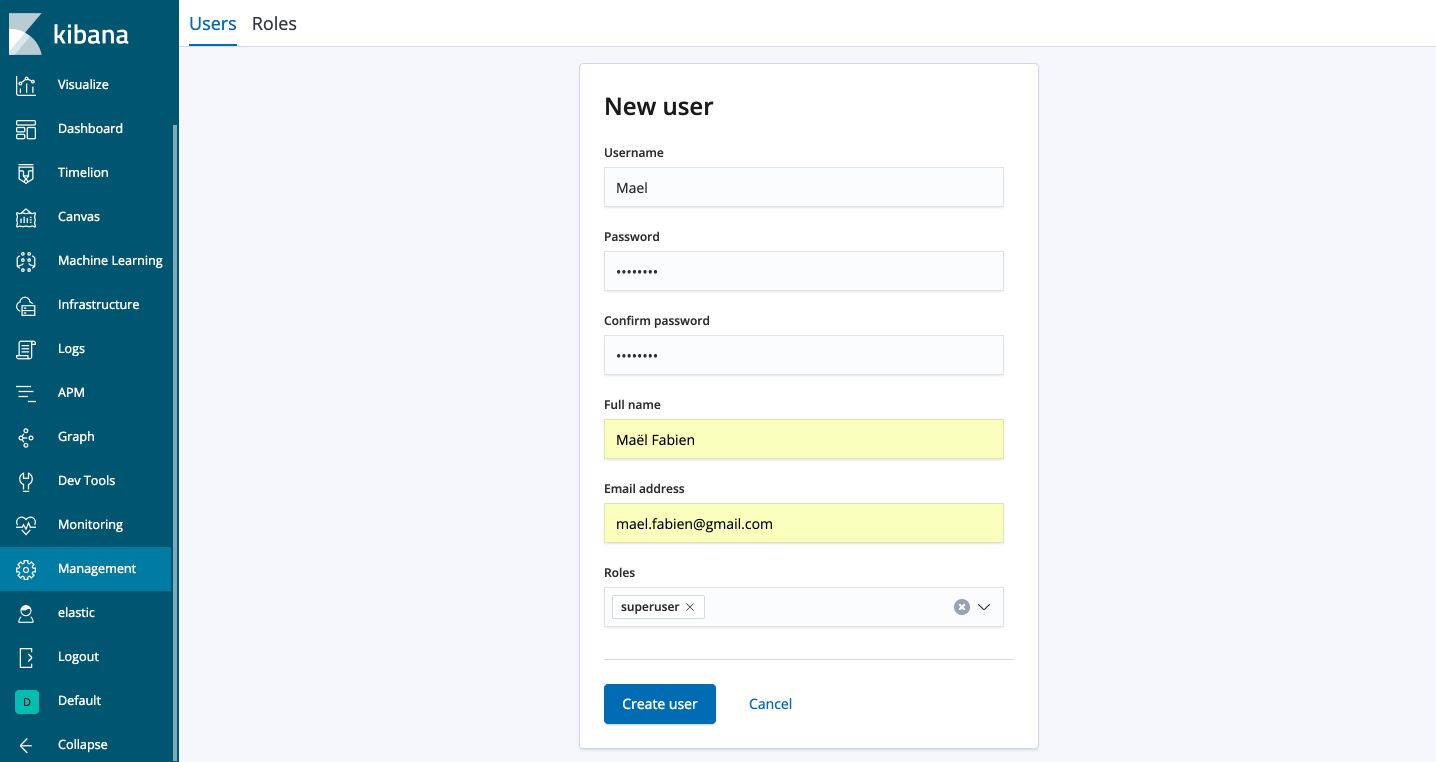
The password you set will be your new user password.
II. Stop the services
Once you have explored your data, you might want to stop the data flow that goes from your machine to Kibana. From the terminal, in the tabs concerned, simply type Ctrl + C.
To stop being charged for Elasticsearch, you’ll have to delete your deployment. All your data will be lost! Keep this in mind.
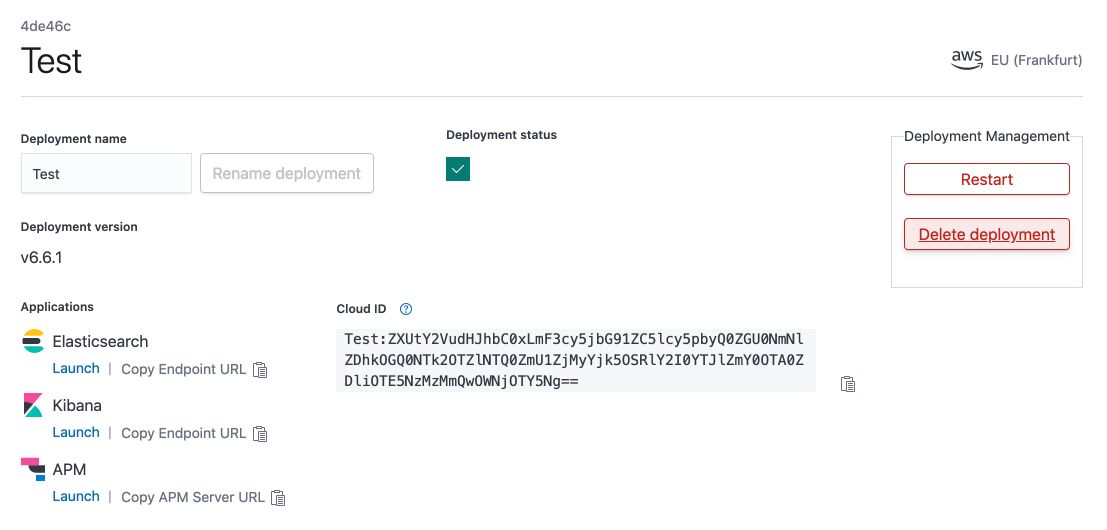
On your Elastic Cloud interface, click on your deployment :
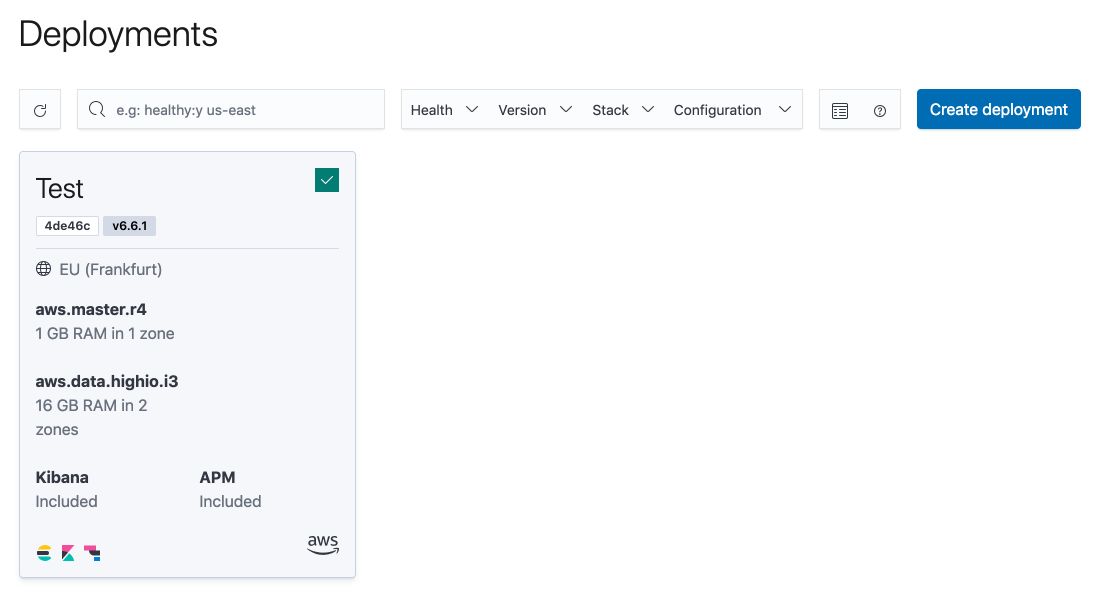
And click on “Delete deployment”.
*Conclusion *: I hope this introduction to Elastic Cloud managed solution was helpful. Don’t hesitate to drop a comment if you have a question or remark.
Sources :